
Panel Data Regression
Introduction
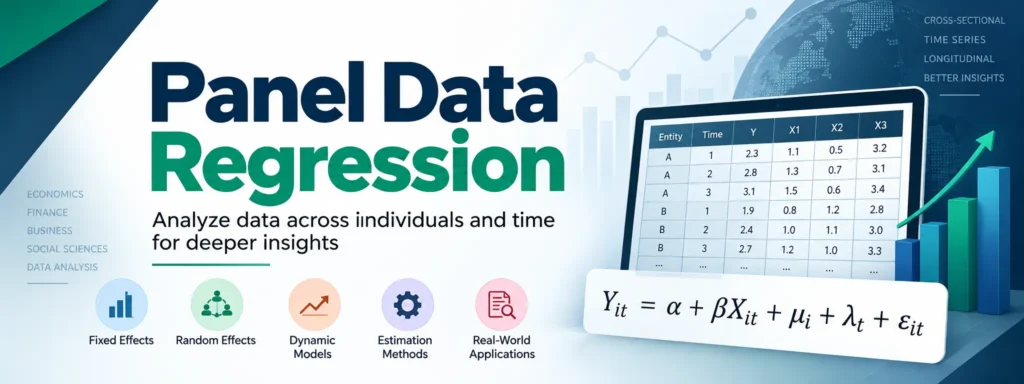
In econometrics and data analysis, Panel Data Regression—also called longitudinal data analysis—provides a powerful way to study how variables change over time across multiple subjects. These subjects may include individuals, firms, countries, or other units of analysis. Panel data combines the characteristics of both cross-sectional data and time-series data, offering richer information for statistical modeling.
One of the major advantages of panel data is its ability to account for individual-specific effects—characteristics unique to each subject that remain constant over time. Ignoring these effects can result in biased estimates. Panel data models distinguish between changes within an entity over time and differences between entities, giving researchers a more detailed framework for analysis.
Panel datasets can be balanced, where every subject is observed during every time period, or unbalanced, where some observations are missing. These datasets support several econometric approaches, including fixed effects, random effects, dynamic panel models, and instrumental variables estimation.
Table of Contents
Complete Advance AI Topics: Click Here
SQL Tutorial: Click Here
Panel Data Models
1. Pooled OLS Regression
Pooled Ordinary Least Squares (OLS) combines observations from all entities and time periods into one dataset. It assumes that there are no unique individual effects among the entities.
Although pooled OLS is simple to implement, it can overlook unobserved differences between entities. This may result in biased estimates when those differences are related to the explanatory variables. However, it can be useful as an initial model when individual-specific effects are considered negligible.
2. Fixed Effects (FE) Model
The Fixed Effects (FE) model accounts for characteristics that are specific to each entity by allowing each entity to have its own intercept.
The model removes time-invariant characteristics through a transformation and focuses primarily on within-entity variation. Fixed effects are particularly appropriate when unobserved individual characteristics are correlated with the independent variables.
3. Random Effects (RE) Model
The Random Effects (RE) model assumes that entity-specific effects are random and are not correlated with the explanatory variables.
It generally uses Generalized Least Squares (GLS) to account for the structure of panel observations. When its assumptions are satisfied, the random effects model can be more efficient than fixed effects, particularly when there is substantial variation both within and between entities.
Choosing Between Fixed and Random Effects
The Hausman test is commonly used to help choose between fixed effects and random effects models.
The test examines whether the individual-specific effects are correlated with the explanatory variables.
- If the effects are correlated with the regressors, the Fixed Effects model is generally preferred.
- If there is no significant correlation, the Random Effects model can provide a more efficient estimate.
The choice should ultimately depend on the research design, assumptions, and characteristics of the dataset.
Advanced Panel Data Techniques
1. Dynamic Panel Data Models
Dynamic panel models include lagged dependent variables among the predictors. This allows the model to capture persistence, inertia, or adjustment behavior over time.
Methods such as the Arellano-Bond estimator are commonly used to address issues such as endogeneity and autocorrelation, particularly in panels with many entities and relatively few time periods.
2. Instrumental Variables (IV) for Panel Data
Instrumental Variables (IV) techniques are useful when explanatory variables are potentially endogenous.
An instrument should be correlated with the endogenous explanatory variable while remaining uncorrelated with the error term. IV methods can therefore help address problems caused by omitted variables, measurement errors, or reverse causality.
3. Nonlinear Panel Models
Nonlinear panel models are useful when the dependent variable is not continuous.
- Logit models for binary outcomes
- Probit models for binary outcomes
- Poisson regression for count data
- Other nonlinear models designed for specific types of dependent variables
These approaches extend panel data analysis beyond standard linear regression.
Estimation Methods in Panel Data
Fixed Effects Estimator (Within Estimator)
The within estimator subtracts the entity-specific mean from each observation. This removes time-invariant individual effects and allows the analysis to focus on changes occurring within each entity over time.
Between Estimator
The between estimator calculates the average value of each variable for every entity across the observed time periods. Regression is then performed using these averages, emphasizing differences between entities.
First-Difference Estimator
The first-difference estimator calculates changes between consecutive time periods. By differencing the observations, time-invariant individual effects can be eliminated.
This method can be useful when the assumptions required for a standard fixed effects approach are not suitable.
Generalized Method of Moments (GMM)
Generalized Method of Moments (GMM) is a flexible estimation approach that is particularly useful for dynamic panel models.
For example, Arellano-Bond GMM uses lagged variables as instruments to help address endogeneity and serial correlation.
Random Effects Estimator
The Random Effects estimator generally uses GLS under the assumption that entity-specific effects are uncorrelated with the explanatory variables.
It can be useful when researchers want to incorporate both within-entity and between-entity variation and when the random effects assumptions are reasonable.
Hausman-Taylor Estimator
The Hausman-Taylor estimator provides a hybrid approach that can accommodate both time-varying and time-invariant variables, including situations where some explanatory variables are endogenous.
It combines elements of fixed effects, random effects, and instrumental variable estimation.
Applications of Panel Data Regression
1. Economic Growth Studies
Case Study: Researchers can use panel data from multiple countries to examine the relationship between infrastructure investment and GDP. By accounting for country-specific and time-specific effects, researchers can better estimate the relationship between infrastructure development and economic growth.
2. Labour Market Analysis
Example: A decade-long study of U.S. wage growth can use panel data to examine the effects of education, experience, and industry changes. A fixed effects model can help identify how changes within individuals are associated with changes in wages.
3. Financial Accounting
Case Study: Analysts can evaluate how corporate governance influences firm performance using panel data from publicly listed companies. Variables such as board independence and shareholder rights can be examined alongside profitability and financial risk.
4. Public Health and Epidemiology
Example: Panel data can be used to study smoking restrictions across multiple cities over time. Researchers can compare changes in respiratory-related hospital admissions before and after policy implementation while accounting for city-specific characteristics.
5. Environmental Economics
Case Study: Researchers can assess pollution-control policies across different regions using dynamic panel models. Investments in clean technology and regulatory enforcement can then be analyzed in relation to changes in air quality over time.
6. Education Research
Panel data allows researchers to track students’ academic outcomes over multiple periods. Researchers can examine factors such as class size, curriculum changes, and teacher quality to better understand factors associated with educational performance.
7. Political Science
Panel regression can be applied to political data to study how institutions, elections, and public policies influence voter behavior and policy outcomes across different regions and time periods.
Download New Real Time Projects :- Click here
Conclusion
Panel Data Regression is an important tool in modern empirical research. It allows analysts to account for time dynamics, individual heterogeneity, and differences between entities in ways that purely cross-sectional or time-series datasets cannot.
From economics and finance to public health, education, environmental studies, and political science, panel data techniques provide researchers with a richer framework for identifying relationships and understanding changes over time.
Understanding panel data regression can therefore help analysts make more informed conclusions when working with datasets that contain observations across multiple entities and multiple time periods.
Keywords: panel data regression, panel data regression Stata, panel data regression in Excel, panel data regression in R, panel data regression formula, panel data regression example, panel data regression PDF, panel data regression Python, panel data regression SPSS, panel data, Stata