Confusion Matrix in Machine Learning
In machine learning, evaluating the performance of a classification model is very important. One of the most useful and easy-to-understand tools for this is the Confusion Matrix.
A confusion matrix helps us understand not only how accurate a model is, but also how and where the model is making mistakes.
Let’s understand the confusion matrix in a simple and professional way.
Complete Advance AI Topics: Click Here
SQL Tutorial: Click Here
What is a Confusion Matrix?
A Confusion Matrix is a performance measurement tool used for classification problems in machine learning. It is especially useful when the output contains two or more classes and the actual labels of the test data are known.
It is also known as an error matrix because it shows both the correct predictions and the different types of errors made by the model.
Structure of a Confusion Matrix
For binary classification, such as Yes/No or 1/0, a confusion matrix consists of a 2×2 matrix.
For a classification problem with three classes, it becomes a 3×3 matrix, and so on.
The matrix contains:
- Actual values from the test data
- Predicted values generated by the model
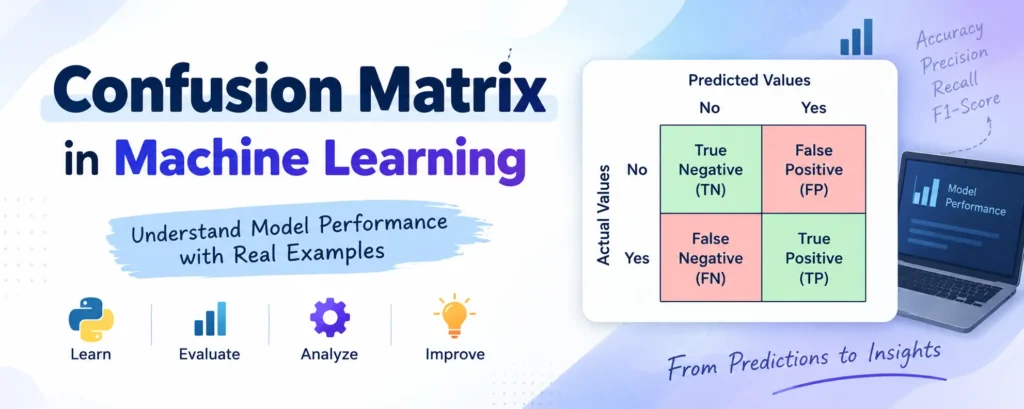
The general structure of a binary classification confusion matrix is:
| Actual / Predicted | Predicted: No | Predicted: Yes |
|---|---|---|
| Actual: No | True Negative (TN) | False Positive (FP) |
| Actual: Yes | False Negative (FN) | True Positive (TP) |
Meaning of Each Term
- True Positive (TP): The model correctly predicted Yes.
- True Negative (TN): The model correctly predicted No.
- False Positive (FP): The model predicted Yes, but the actual result was No. This is also known as a Type I Error.
- False Negative (FN): The model predicted No, but the actual result was Yes. This is also known as a Type II Error.
Why Use a Confusion Matrix?
A confusion matrix is useful because it:
- Evaluates the performance of classification models.
- Shows not only the number of errors but also what type of errors the model is making.
- Helps calculate different performance metrics such as:
- Accuracy
- Precision
- Recall
- F1-Score
- Misclassification Rate
Example Scenario
Suppose you are building a medical diagnosis system that predicts whether a patient has a disease. You test the model with 100 patients.
| Actual / Predicted | Predicted: No | Predicted: Yes |
|---|---|---|
| Actual: No (73) | 65 | 8 |
| Actual: Yes (27) | 3 | 24 |
Insights
- There are 89 correct predictions (65 TN + 24 TP).
- There are 11 incorrect predictions (8 FP + 3 FN).
- The model predicted Yes 32 times and No 68 times.
Important Confusion Matrix Metrics
Accuracy
Accuracy tells us how often the model makes the correct prediction.
Accuracy = (TP + TN) / Total Predictions
         = (24 + 65) / 100
         = 89%
Misclassification Rate (Error Rate)
The error rate shows how often the model makes an incorrect prediction.
Error Rate = (FP + FN) / Total Predictions
           = (8 + 3) / 100
           = 11%
Precision
Precision tells us how many of the instances predicted as positive were actually positive.
Precision = TP / (TP + FP)
          = 24 / (24 + 8)
          = 75%
Recall (Sensitivity)
Recall tells us how many of the actual positive cases were correctly identified by the model.
Recall = TP / (TP + FN)
       = 24 / (24 + 3)
       = 88.89%
F1 Score
The F1 Score is the harmonic mean of Precision and Recall.
F1 Score = 2 * (Precision * Recall) / (Precision + Recall)
         = 2 * (0.75 * 0.889) / (0.75 + 0.889)
         = 0.813 or 81.3%
Other Important Concepts
Null Error Rate
The null error rate represents the error that would occur if the model always predicted the majority class.
It is useful for checking whether the model is actually learning meaningful patterns or simply predicting the most common outcome.
ROC Curve (Receiver Operating Characteristic)
The ROC Curve is a graph that plots the True Positive Rate (Recall) against the False Positive Rate.
It is used to evaluate classifiers at different threshold values.
Download New Real Time Projects :- Click here
Conclusion
The Confusion Matrix is more than just a table. It gives us a clear view of how a classification model is making its decisions.
It helps identify the model’s strengths and weaknesses and provides useful information for improving its real-world performance.
Whether you are working on a health app, spam filter, or fraud detection system, understanding the confusion matrix is an important part of working with machine learning classification models.