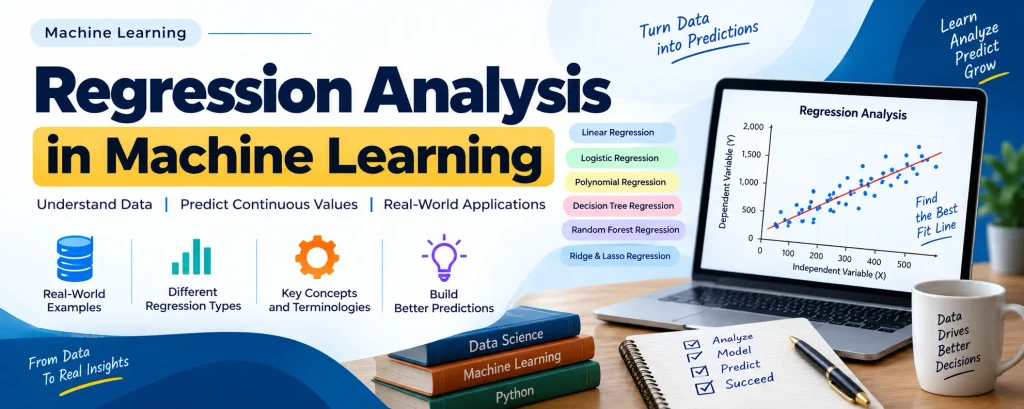
Regression Analysis in Machine Learning
In the constantly evolving world of machine learning, regression analysis is one of the key techniques used for predicting continuous values. Whether it is estimating real estate prices or forecasting weather conditions, regression helps machines understand patterns in data and make data-driven predictions.
Let’s explore this useful statistical technique, its real-world applications, different types, important terminology, and how it helps machines work with numerical data.
Complete Advance AI Topics: Click Here
SQL Tutorial: Click Here
What is Regression Analysis?
Regression Analysis is a statistical method used to understand and model the relationship between a dependent variable (target) and one or more independent variables (predictors). It helps us understand how the target changes when the predictor variables change while keeping the other variables constant.
In simple words, regression can help answer questions such as:
- “If we increase the advertising budget, how will it affect sales?”
- “What kind of salary can someone expect based on their experience?”
Example Use Case
Suppose a marketing company, Company A, spends different amounts on advertising every year and records the corresponding sales:
| Year | Advertisement Spend ($) | Sales ($) |
|---|---|---|
| 2014 | 100 | 500 |
| 2015 | 200 | 800 |
| 2016 | 300 | 900 |
| 2017 | 400 | 1200 |
| 2018 | 500 | 1500 |
Now, in 2019, if the company spends $200 on advertising, it wants to estimate the expected sales. Regression analysis can help predict this value using a mathematical model.
Why Use Regression in Machine Learning?
Regression is a supervised learning algorithm that helps identify patterns between input features and continuous output values. It plays an important role in:
- Prediction and forecasting
- Time series modeling
- Analyzing causal-effect relationships
Key Advantages:
- Helps estimate relationships between variables.
- Can predict real-world values such as age, temperature, or prices.
- Helps identify trends in large datasets.
- Can highlight important influencing factors.
Important Terminologies
- Dependent Variable: The value we want to predict, such as Sales.
- Independent Variable: The features used to make a prediction, such as Advertisement Spend.
- Outliers: Data points that are significantly different from other observations. They can affect the accuracy of the model.
- Multicollinearity: A situation where predictor variables are highly correlated with each other, which can affect the reliability of the model.
- Overfitting: The model performs well on training data but performs poorly when given unseen data.
- Underfitting: The model performs poorly on both training and test data because it is too simple.
Types of Regression in Machine Learning
Machine learning offers different regression techniques for handling different types of problems. Some of the commonly used ones are given below:
1. Linear Regression
Linear Regression is the simplest form of regression. It represents the relationship between the dependent and independent variables using a straight line.
Equation:
Y = aX + b
Where:
Yis the predicted value (target).Xis the independent variable.aandbare the model coefficients.
Applications:
- Salary prediction based on experience.
- Forecasting real estate prices.
- Predicting stock trends.
When there is only one feature, it is called Simple Linear Regression. When multiple features are used, it becomes Multiple Linear Regression.
2. Logistic Regression
Logistic Regression is actually a classification algorithm, despite having “regression” in its name. It is used when the dependent variable is categorical, such as Yes/No, True/False, or 0/1.
It uses the sigmoid function to map predictions to values between 0 and 1:
f(x) = 1 / (1 + e^(-x))It is commonly used for:
- Spam detection.
- Loan approval prediction.
- Disease diagnosis (Positive/Negative).
Types:
- Binary Logistic Regression
- Multinomial Logistic Regression
- Ordinal Logistic Regression
3. Polynomial Regression
Polynomial Regression is an extension of linear regression that is useful for modeling non-linear relationships. Instead of fitting a straight line, it fits a polynomial curve to the data.
Equation:
Y = b0 + b1x + b2x² + b3x³ + ... + bnxⁿIt can be used when the data points follow a curved pattern, such as:
- Predicting population growth.
- Estimating complex sales patterns.
- Modeling learning curves.
4. Support Vector Regression (SVR)
Derived from Support Vector Machine (SVM), Support Vector Regression (SVR) is used for regression-related tasks.
Its key components include:
- Hyperplane: Used to predict output values.
- Margin (Boundary lines): Defines the allowable error.
- Support Vectors: Data points located closest to the hyperplane.
SVR aims to find a function that stays within an ε deviation from the actual values while keeping the function as flat as possible.
Use Cases:
- Stock price prediction.
- Load forecasting.
- Real-time traffic analysis.
5. Decision Tree Regression
Decision Trees divide data into different branches to make predictions. They can work with both categorical and numerical data.
Each node represents a decision based on an attribute, while the leaves represent the resulting output.
Use Cases:
- Recommender systems.
- Loan risk analysis.
- Personalized marketing strategies.
6. Random Forest Regression
Random Forest is an ensemble approach that combines several decision trees to improve prediction accuracy.
It uses bagging (bootstrap aggregation) to create trees from random subsets of the data and then averages their results.
Benefits:
- Reduces overfitting.
- Works efficiently with large datasets.
- Improves prediction performance.
7. Ridge Regression (L2 Regularization)
Ridge Regression adds a penalty term to the model to reduce complexity and help prevent overfitting.
Equation:
Minimize (Sum of Squared Errors + λ * Σ(weights²))
It is ideal when:
- High multicollinearity exists.
- The number of predictors is greater than the number of samples.
- The goal is to reduce variance.
8. Lasso Regression (L1 Regularization)
Lasso Regression (Least Absolute Shrinkage and Selection Operator) is similar to Ridge Regression, but it uses absolute weights instead of squared weights.
Equation:
Minimize (Sum of Squared Errors + λ * Σ|weights|)
Its unique ability is that it can:
- Shrink coefficients to zero.
- Automatically perform feature selection.
It is best suited for:
- Sparse datasets.
- Identifying key predictors.
- Building simple and interpretable models.
Download New Real Time Projects :- Click here
Final Thoughts
Regression analysis has a foundational place in machine learning and data science. It helps us convert real-world problems into mathematical models. Whether the goal is to predict housing prices or estimate future demand, regression gives machines a way to work with numbers and identify patterns.
types of regression in machine learning
linear regression in machine learning
logistic regression machine learning
classification in machine learning
multiple linear regression in machine learning
polynomial regression in machine learning
clustering in machine learning
classification and regression in machine learning
linear regression
decision tree in machine learning
regression analysis in machine learning with example
regression analysis in machine learning geeksforgeeks
regression analysis in machine learning python
Regression Analysis