Hierarchical Clustering in Machine Learning
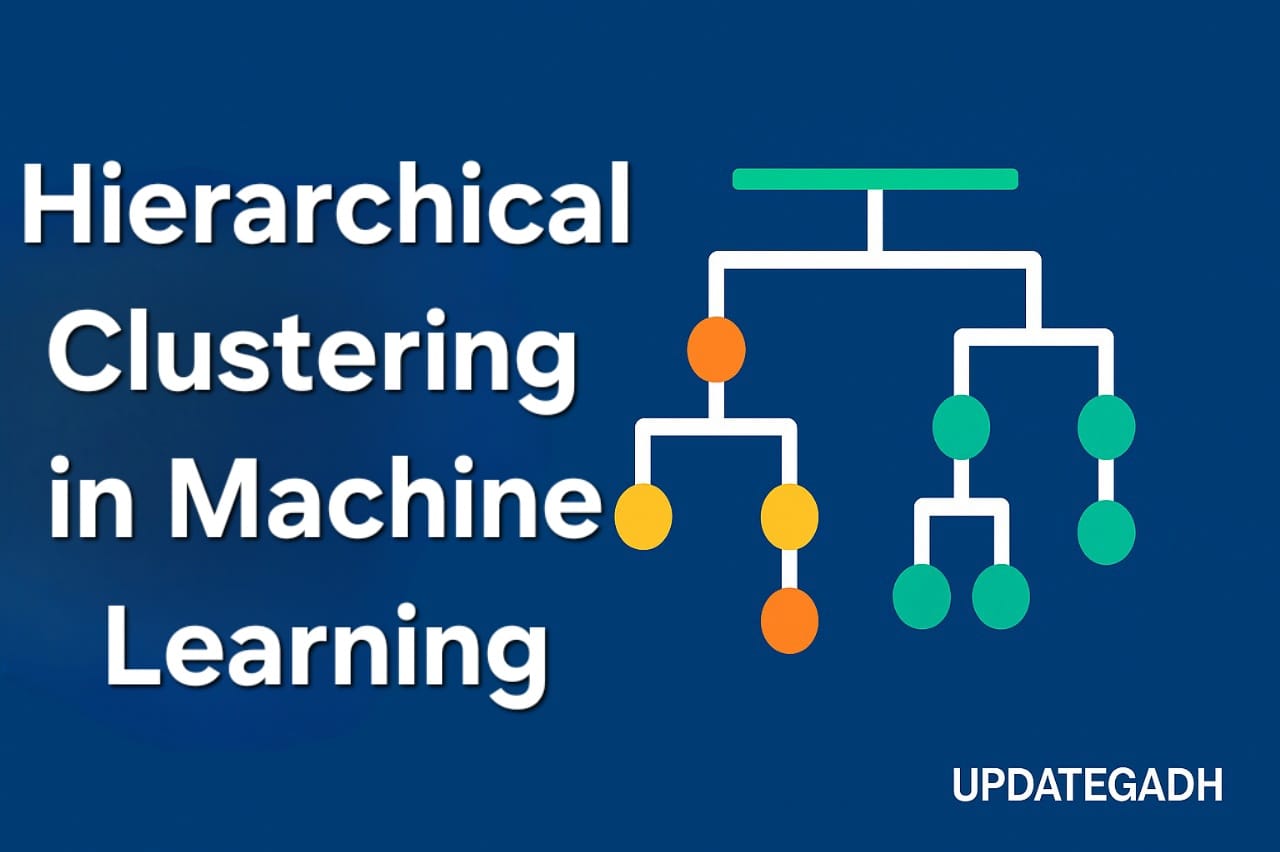
In the field of unsupervised machine learning, Hierarchical Clustering is a popular technique used to discover patterns and groups within unlabeled datasets. It organizes data into a tree-like structure called a dendrogram, making it easier to understand how different data points are related to each other.
In this article, lets understand how hierarchical clustering works, why it is useful, and how to implement it in Python.
Complete Advance AI Topics: Click Here
SQL Tutorial: Click Here
What is Hierarchical Clustering?
Hierarchical clustering groups data points based on their similarity and creates a hierarchy of clusters. The clusters are arranged in a tree-like structure, where each merge or split represents a different stage of the clustering process.
It is different from K-Means Clustering in several ways:
- The number of clusters does not always need to be decided before creating the hierarchy.
- A dendrogram provides a visual representation that can help determine the appropriate number of clusters.
There are two main approaches to hierarchical clustering:
- Agglomerative (Bottom-Up): Starts with every data point as an individual cluster and gradually combines the closest clusters.
- Divisive (Top-Down): Starts with all data points in a single cluster and recursively divides them into smaller clusters.
In this article, we will focus on Agglomerative Hierarchical Clustering.
Why Use Hierarchical Clustering?
K-Means is widely used because it is simple and fast, but it also has some limitations:
- It requires the number of clusters to be specified in advance.
- It works best when clusters have relatively similar characteristics.
Hierarchical clustering provides more flexibility by:
- Allowing the number of clusters to be selected after examining the clustering hierarchy.
- Supporting different cluster shapes and sizes depending on the linkage method.
- Providing a dendrogram that helps visualize and interpret the clustering process.
How Does Agglomerative Hierarchical Clustering Work?
Agglomerative hierarchical clustering starts with individual data points and gradually merges them until all points belong to a single cluster.
Step 1: Consider Every Data Point as a Separate Cluster
If you have N data points, the algorithm initially considers each point as an individual cluster. Therefore, there are N clusters at the beginning.
Step 2: Combine the Two Closest Clusters
The algorithm identifies the two closest clusters and combines them. This reduces the total number of clusters from N to N – 1.
Step 3: Repeat the Process
The process continues by finding and merging the closest clusters until all the data points belong to a single cluster.
Step 4: Build a Dendrogram
The complete merging process is represented using a dendrogram. By cutting the dendrogram at a selected level, you can obtain the desired number of clusters.
Download New Real Time Projects :- Click here
Measuring Distance Between Clusters (Linkage Criteria)
The way the distance between clusters is calculated determines which clusters are merged together. Some commonly used linkage methods are:
- Single Linkage: Measures the distance between the two closest points from different clusters.
- Complete Linkage: Measures the distance between the two farthest points from different clusters.
- Average Linkage: Calculates the average distance between all pairs of points from the two clusters.
- Centroid Linkage: Measures the distance between the centroids of the clusters.
The choice of linkage method depends on the characteristics of your dataset and the clustering problem.
Dendrogram: Visualizing the Cluster Hierarchy
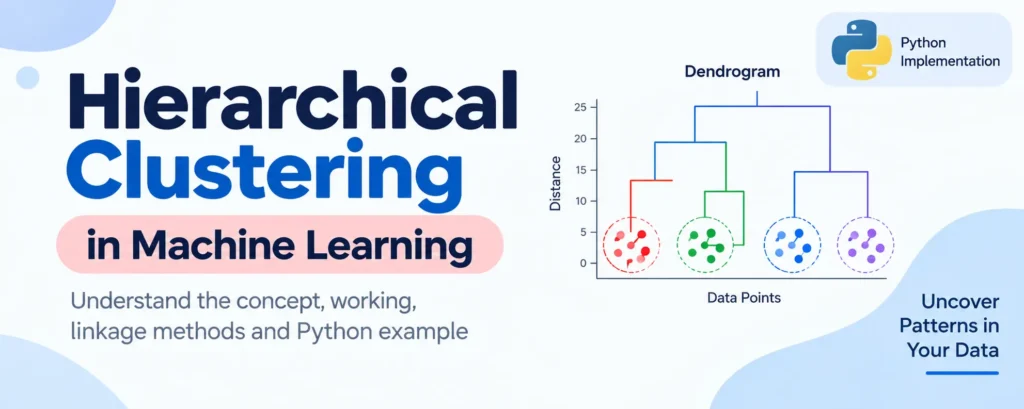
A dendrogram represents the complete hierarchy of cluster merges in a tree-like structure. It helps you understand how data points are grouped at different levels.
Here is how to read a dendrogram:
- X-axis: Represents the data points or observations.
- Y-axis: Represents the distance at which clusters are merged.
A horizontal cut across the dendrogram produces a specific number of clusters. You can select a suitable cut by looking for a large vertical distance where a horizontal line can be drawn without crossing multiple cluster merges.
Python Implementation of Hierarchical Clustering
Lets use a practical example where we group mall customers based on their Annual Income and Spending Score.
Step 1: Data Preprocessing
# Import libraries
import numpy as np
import matplotlib.pyplot as plt
import pandas as pd

# Load dataset
dataset = pd.read_csv('Mall_Customers_data.csv')

X = dataset.iloc[:, [3, 4]].values  # Annual Income and Spending Score
Step 2: Creating the Dendrogram
import scipy.cluster.hierarchy as sch

# Create dendrogram
dendrogram = sch.dendrogram(sch.linkage(X, method='ward'))

plt.title("Dendrogram")
plt.xlabel("Customers")
plt.ylabel("Euclidean Distance")
plt.show()
The ward method attempts to minimize the variance within the resulting clusters. The dendrogram helps you determine an appropriate number of clusters for the dataset.
Step 3: Training the Hierarchical Clustering Model
from sklearn.cluster import AgglomerativeClustering

hc = AgglomerativeClustering(
    n_clusters=5,
    affinity='euclidean',
    linkage='ward'
)

y_hc = hc.fit_predict(X)
n_clusters=5: Specifies the number of clusters selected from the dendrogram.affinity='euclidean': Specifies the distance metric.linkage='ward': Specifies the linkage method used to merge clusters.
Step 4: Visualizing the Clusters
plt.scatter(X[y_hc == 0, 0], X[y_hc == 0, 1], s=100, c='red', label='Cluster 1')
plt.scatter(X[y_hc == 1, 0], X[y_hc == 1, 1], s=100, c='blue', label='Cluster 2')
plt.scatter(X[y_hc == 2, 0], X[y_hc == 2, 1], s=100, c='green', label='Cluster 3')
plt.scatter(X[y_hc == 3, 0], X[y_hc == 3, 1], s=100, c='cyan', label='Cluster 4')
plt.scatter(X[y_hc == 4, 0], X[y_hc == 4, 1], s=100, c='magenta', label='Cluster 5')

plt.title('Customer Segments')
plt.xlabel('Annual Income')
plt.ylabel('Spending Score')
plt.legend()
plt.show()
Download New Real Time Projects :- Click here
Conclusion
Hierarchical clustering is a useful and intuitive technique for working with unlabeled data when you want flexibility in selecting the number of clusters. Its dendrogram provides a clear visual representation of how clusters are formed and helps with exploratory data analysis.
Compared to K-Means, hierarchical clustering provides a complete clustering hierarchy, allowing you to examine the data at different levels of grouping.
Key Takeaways
- No need to decide the final number of clusters before creating the hierarchy.
- Linkage methods such as Ward, Single, and Complete determine how clusters are merged.
- The dendrogram is useful for visually analyzing the clustering hierarchy and selecting clusters.
hierarchical clustering in machine learning with example
k-means clustering in machine learning
hierarchical clustering example
divisive hierarchical clustering
divisive hierarchical clustering in machine learning
hierarchical clustering algorithm
agglomerative hierarchical clustering
hierarchical clustering in machine learning geeksforgeeks
knn in machine learning
clustering in machine learning
hierarchical clustering in machine learning python
hierarchical clustering in machine learning
explain hierarchical clustering in machine learning
divisive hierarchical clustering in machine learning
applications of hierarchical clustering in machine learning
advantages of hierarchical clustering in machine learning
non hierarchical clustering in machine learning
hierarchical clustering in machine learning python
hierarchical clustering in machine learning pdf
hierarchical clustering in machine learning example
hierarchical clustering in machine learning medium
hierarchical clustering in machine learning types