K-Means Clustering Algorithm
What is K-Means Clustering
In data science and machine learning, K-Means Clustering is a popular unsupervised learning technique used to group unlabelled data into meaningful clusters. It is especially useful when you want to find patterns or groups in your data without having predefined labels.
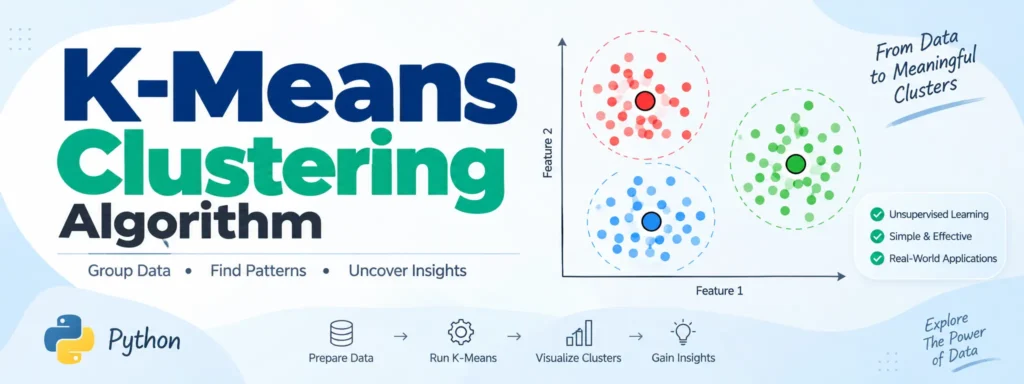
At its core, the algorithm divides data into K clusters, where each data point is assigned to the cluster with the nearest centroid. This helps reveal hidden groupings and similarities within the dataset.
Example: If K = 3, the algorithm creates three clusters and assigns each data point to one of them based on similarity and distance.
Complete Advance AI Topics: Click Here
SQL Tutorial: Click Here
How Does the K-Means Algorithm Work?
K-Means is an iterative algorithm that repeatedly assigns data points to clusters and updates their centroids. The main steps are:
- Choose K: Decide the number of clusters you want to create.
- Initialize K centroids: Select initial centroids for the clusters.
- Assign data points: Assign every data point to the closest centroid.
- Update centroids: Calculate the mean of the points in each cluster and use it as the new centroid.
- Repeat: Continue assigning points and updating centroids until the centroids stop changing or the algorithm reaches convergence.
Goal: Minimize the sum of squared distances between each data point and the centroid of its assigned cluster.
Visualizing the Steps
Suppose we have two variables, M1 and M2, plotted on a scatter plot. If we choose K = 2, two initial centroids are selected and each data point is assigned to the nearest centroid.
The algorithm then:
- Calculates new centroids for each cluster.
- Reassigns data points based on the updated centroids.
- Repeats the process until the clusters no longer change significantly.
After several iterations, the algorithm produces clusters where points within the same cluster are more similar to each other, while points belonging to different clusters are more distinct.
How to Choose the Right Value of K?
Choosing the appropriate number of clusters, represented by K, is an important part of K-Means Clustering. One of the most commonly used techniques for finding a suitable value of K is the Elbow Method.
Elbow Method
The Elbow Method works by:
- Running K-Means for different values of K, such as K = 1 to 10.
- Calculating WCSS (Within-Cluster Sum of Squares) for each value of K.
- Plotting the WCSS values against the number of clusters.
- Finding the point where the curve bends noticeably, creating an “elbow”.
The elbow point is generally considered a suitable value for K because increasing the number of clusters beyond this point provides smaller improvements in WCSS.
WCSS Formula:
WCSS = Σ (distance of each point from its cluster centroid)2
Python Implementation of K-Means Clustering
Let’s look at a practical implementation of K-Means Clustering using Python. We will use the Mall Customers dataset, which contains customer-related information such as annual income and spending score.
Step 1: Data Preprocessing
# Importing necessary libraries
import numpy as np
import matplotlib.pyplot as plt
import pandas as pd

# Loading the dataset
dataset = pd.read_csv('Mall_Customers_data.csv')

# Selecting features (Annual Income and Spending Score)
x = dataset.iloc[:, [3, 4]].values
Step 2: Finding Optimal K Using Elbow Method
from sklearn.cluster import KMeans

wcss = []

for i in range(1, 11):
    kmeans = KMeans(
        n_clusters=i,
        init='k-means++',
        random_state=42
    )
    kmeans.fit(x)
    wcss.append(kmeans.inertia_)

# Plotting the results
plt.plot(range(1, 11), wcss)
plt.title('The Elbow Method')
plt.xlabel('Number of clusters')
plt.ylabel('WCSS')
plt.show()
After plotting the WCSS values, you can identify the point where the curve starts to bend. This point represents the “elbow” and can be used to select a suitable value of K.
Step 3: Applying K-Means to the Dataset
Suppose the optimal number of clusters is 5. We can apply K-Means with n_clusters=5:
# Let's say the optimal K is 5
kmeans = KMeans(
    n_clusters=5,
    init='k-means++',
    random_state=42
)

y_kmeans = kmeans.fit_predict(x)
Step 4: Visualizing the Clusters
# Visualizing the clusters
plt.scatter(
    x[y_kmeans == 0, 0],
    x[y_kmeans == 0, 1],
    s=100,
    c='red',
    label='Cluster 1'
)

plt.scatter(
    x[y_kmeans == 1, 0],
    x[y_kmeans == 1, 1],
    s=100,
    c='blue',
    label='Cluster 2'
)

plt.scatter(
    x[y_kmeans == 2, 0],
    x[y_kmeans == 2, 1],
    s=100,
    c='green',
    label='Cluster 3'
)

plt.scatter(
    x[y_kmeans == 3, 0],
    x[y_kmeans == 3, 1],
    s=100,
    c='cyan',
    label='Cluster 4'
)

plt.scatter(
    x[y_kmeans == 4, 0],
    x[y_kmeans == 4, 1],
    s=100,
    c='magenta',
    label='Cluster 5'
)

# Plotting centroids
plt.scatter(
    kmeans.cluster_centers_[:, 0],
    kmeans.cluster_centers_[:, 1],
    s=300,
    c='yellow',
    label='Centroids'
)

plt.title('Clusters of Mall Customers')
plt.xlabel('Annual Income (k$)')
plt.ylabel('Spending Score (1-100)')
plt.legend()
plt.show()
Summary
- K-Means is a simple yet effective unsupervised clustering algorithm.
- It works well when groups in the data are relatively distinct and well-separated.
- The algorithm can scale well to large datasets.
- Techniques such as the Elbow Method can help determine a suitable number of clusters.
- K-Means generally works best with clusters that are roughly spherical and similarly sized, so it may not perform well with complex shapes or distributions.
Download New Real Time Projects :- Click here
Final Thoughts
K-Means Clustering is one of the most widely used techniques for finding patterns in unlabeled data. From customer segmentation and market research to image compression, it provides a straightforward way to group similar data points and extract useful insights from a dataset.
Keywords:
k-means clustering example, k-means clustering algorithm in machine learning, k-means clustering solved example, k-means clustering algorithm python, k-means clustering algorithm in data mining, k-means clustering algorithm numerical example, k-means clustering formula, k-medoids clustering