Linear Regression in Machine Learning
Linear Regression is one of the simplest yet powerful algorithms in Machine Learning. Whether you are just starting your ML journey or you are interested in building predictive models, linear regression is one of the concepts you will come across very early.
At its core, linear regression is a statistical technique used for predictive analysis. It is mainly used to predict continuous or numerical values, such as a person’s salary, age, product price, or housing market trends.
Complete Advance AI Topics: Click Here
SQL Tutorial: Click Here
What is Linear Regression?
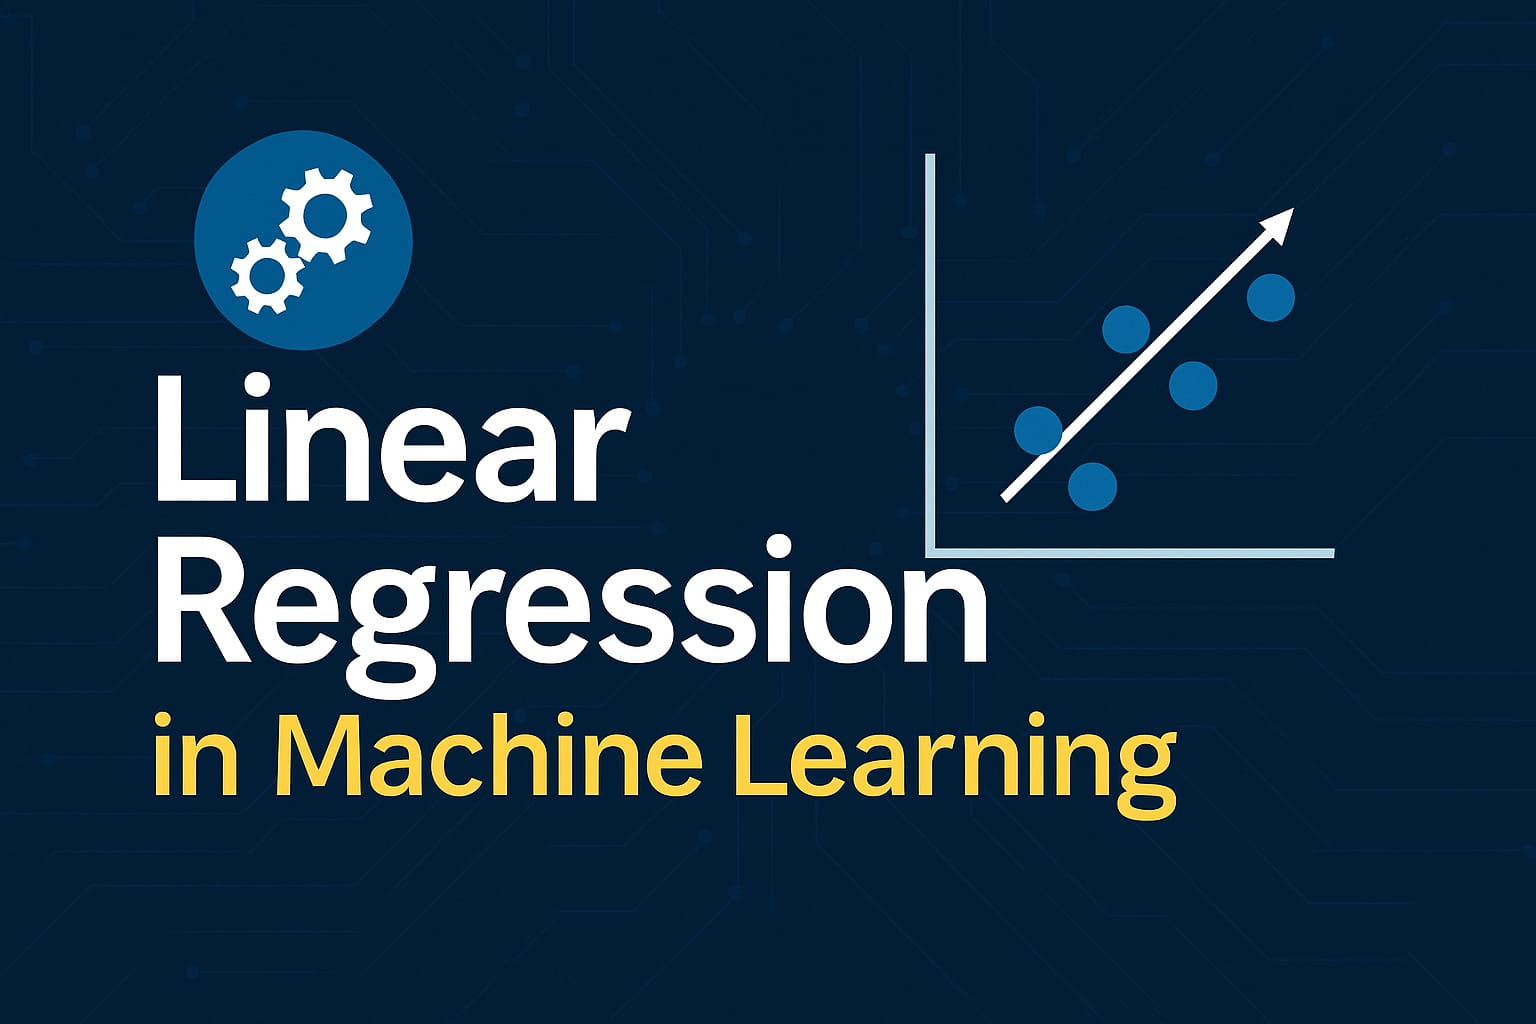
Linear regression is used to describe the linear relationship between a dependent variable (Y) and one or more independent variables (X). It is called linear regression because this relationship can be represented using a straight line.
The main objective is to understand how changes in the independent variable affect the dependent variable.
Mathematical Representation
The linear regression equation can be written as:
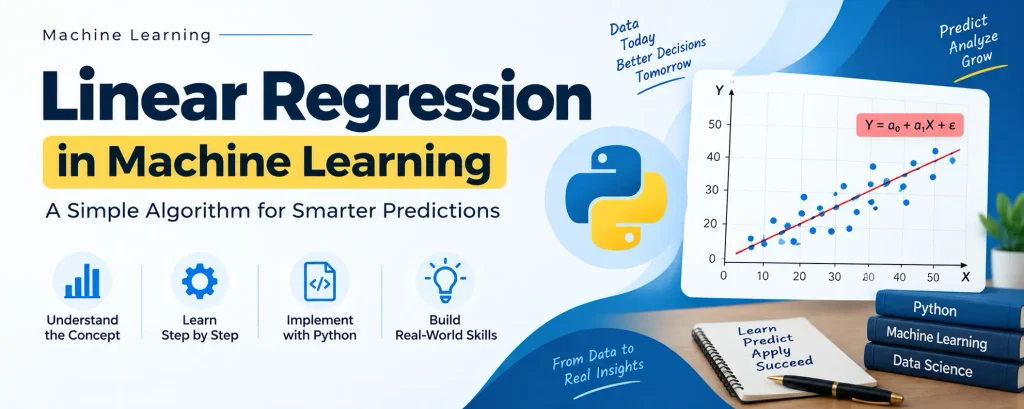
Y = a0 + a1X + ε
Where:
- Y = Dependent Variable (Target)
- X = Independent Variable (Predictor)
- a0 = Intercept (the point where the line crosses the Y-axis)
- a1 = Coefficient (determines the slope of the line)
- ε = Error term (represents noise or randomness)
The dataset used to train a linear regression model contains input-output pairs. These values help the model learn the relationship between the input (X) and output (Y).
Types of Linear Regression
Linear regression is mainly divided into two types:
Simple Linear Regression
Simple Linear Regression is used when we predict the value of a dependent variable using only one independent variable.
Multiple Linear Regression
Multiple Linear Regression is used when the dependent variable is predicted using two or more independent variables.
Regression Line: The Visual Insight
A regression line is the best-fit straight line that represents the relationship between the dependent and independent variables.
Positive Linear Relationship
When the value of X increases, the value of Y also increases.
Negative Linear Relationship
When the value of X increases, the value of Y decreases.
These patterns help data scientists understand and visualize how closely two variables are related.
Finding the Best Fit Line
The main goal of linear regression is to find a line that minimizes the difference between the predicted values and the actual values.
This line is found by calculating the optimal coefficients (a0 and a1) with the help of a cost function.
Cost Function: Mean Squared Error (MSE)
To determine how well the model is performing, we use a cost function. It helps measure the difference between the predicted and actual values.
For linear regression, one of the most commonly used cost functions is:
MSE = (1/N) Σ (Yi − (a0 + a1Xi))²
Where:
- N = Number of data points
- Yi = Actual value
- (a0 + a1Xi) = Predicted value
The function calculates the average squared difference between the actual and predicted values. A lower MSE means the model has a better fit.
Residuals
The differences between the actual values and the values predicted by the regression line are called residuals.
Small residuals indicate more accurate predictions, while large residuals indicate poorer predictions.
In general, the closer the data points are to the regression line, the better the model performs.
Gradient Descent: Minimizing the Error
To minimize the cost function (MSE), linear regression can use a method called Gradient Descent.
How It Works:
- Start with random values for a0 and a1.
- Calculate the gradient, or slope, of the cost function.
- Adjust a0 and a1 in a direction that reduces the cost.
- Repeat the process until convergence and the error reaches its lowest point.
This repeated process helps fine-tune the model so that it can make better predictions.
Evaluating Model Performance
Once a linear regression model has been trained, it is important to check how well it performs. One commonly used metric for this purpose is:
R-squared (R²)
R² measures the goodness of fit, showing how well the regression line represents the data.
- R² = 1: Perfect fit
- R² = 0: No predictive power
A higher R² value indicates a stronger relationship between the input and output variables.
Assumptions of Linear Regression
For reliable results, linear regression depends on several important assumptions:
1. Linearity
The relationship between the input and output variables should be linear.
2. No Multicollinearity
Independent variables should not be highly correlated with each other. High multicollinearity can make it difficult to determine the actual influence of individual predictors.
3. Homoscedasticity
The variance of the residuals should remain consistent across the different values of the independent variable.
4. Normal Distribution of Errors
The error terms should follow a normal distribution. This helps when creating accurate confidence intervals and predictions.
5. No Autocorrelation
Error terms should not be correlated with one another. Autocorrelation can reduce model accuracy, particularly when working with time series data.
Download New Real Time Projects :- Click here
Final Thoughts
Linear Regression continues to be one of the most fundamental and interpretable techniques in machine learning. Its strength comes from its simplicity, while it also provides a foundation for understanding more complex models in deep learning and AI.
Whether you are predicting house prices, studying sales trends, or analyzing marketing strategies, linear regression can often be the first step toward finding useful insights.
So, the next time you come across a dataset filled with numbers waiting to be understood, remember that sometimes a simple line is enough to reveal powerful patterns.
Stay tuned for more simplified explanations, real-world applications, and beginner-friendly ML concepts!
linear regression in machine learning python
logistic regression machine learning
linear regression in machine learning example
linear regression in machine learning formula
multiple linear regression in machine learning
linear regression in machine learning project
linear regression in machine learning code
non linear regression in machine learning
Linear Regression in Machine Learning