Simple Linear Regression in Machine Learning
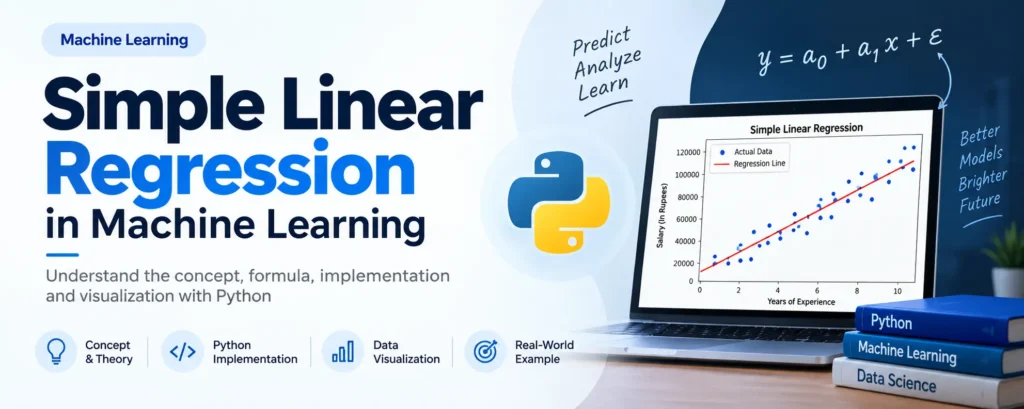
Machine Learning provides many algorithms for solving practical problems, and Simple Linear Regression is one of the most basic and widely used regression techniques. It can be used to study the relationship between two variables and make predictions, such as estimating a salary from years of experience or predicting a house price from its size.
Complete Advance AI Topics: Click Here
SQL Tutorial: Click Here
What is Simple Linear Regression?
Simple Linear Regression is a regression method used to analyze the relationship between two variables:
- One independent variable (X)
- One dependent variable (Y)
The algorithm tries to find a straight line that best represents the relationship between the given data points. This line can then be used to predict the dependent variable from the independent variable. Since the model assumes a linear relationship between the variables, it is known as Simple Linear Regression.
Important: The dependent variable (Y) should be continuous, such as income or salary. The independent variable (X) can be either categorical or continuous.
Objectives of Simple Linear Regression
Simple Linear Regression is mainly used for two important purposes:
Understanding the relationship between two variables
For example, analyzing the relationship between years of experience and salary, or investment and revenue.
Making predictions on new data
For example, predicting revenue, estimating costs, or forecasting values based on available data.
Mathematical Formula
The basic equation used in Simple Linear Regression is:
y = a0 + a1*x + εHere:
- a0 = Intercept, which represents the value of y when x is 0
- a1 = Slope of the regression line, indicating its direction and steepness
- ε = Error term, representing the variation that the model cannot explain
A good regression model aims to keep the prediction error relatively small so that the predicted values are close to the actual observations.
Implementation of Simple Linear Regression in Python
Let’s implement a Simple Linear Regression model in Python using a salary and experience dataset.
Problem Statement
For this example, we will work with a dataset containing two columns:
- Experience (in years) – Independent variable
- Salary (in rupees) – Dependent variable
Goals:
- Determine whether there is a relationship between experience and salary
- Visualize the best-fitting regression line
- Predict salary using years of experience
Step 1: Data Preprocessing
First, import the libraries required for the implementation:
import numpy as np
import matplotlib.pyplot as plt
import pandas as pd
Next, load the salary dataset:
data = pd.read_csv('Salary_Data.csv')Now, separate the independent and dependent variables:
X = data.iloc[:, :-1].values  # Experience
Y = data.iloc[:, 1].values   # Salary
The dataset can then be divided into training and testing data:
from sklearn.model_selection import train_test_split

X_train, X_test, Y_train, Y_test = train_test_split(
    X, Y, test_size=1/3, random_state=0
)
Step 2: Fitting the Simple Linear Regression Model
Once the data has been prepared, we can train the Simple Linear Regression model using the training dataset.
from sklearn.linear_model import LinearRegression

regressor = LinearRegression()
regressor.fit(X_train, Y_train)
During this step, the model learns the relationship between years of experience and salary from the training data.
Step 3: Predicting the Results
After training the model, we can use it to generate predictions for both the training and test datasets.
Y_pred_test = regressor.predict(X_test)
Y_pred_train = regressor.predict(X_train)
These predicted values can be compared with the actual values to understand how closely the model represents the data.
Step 4: Visualizing the Training Set
Let’s visualize the training data along with the regression line generated by the model.
plt.scatter(X_train, Y_train, color='green')  # Actual points
plt.plot(X_train, Y_pred_train, color='red')  # Regression line

plt.title("Salary vs Experience (Training Dataset)")
plt.xlabel("Years of Experience")
plt.ylabel("Salary (In Rupees)")
plt.show()
Output:
The graph will display the actual salary values as green points, while the red line represents the regression line predicted by the model. The closer the line is to the data points, the better the model represents the training data.
Step 5: Visualizing the Test Set
Next, we can visualize the test dataset to see how the trained model performs on data it has not seen during training.
plt.scatter(X_test, Y_test, color='blue')  # Actual test data
plt.plot(X_train, Y_pred_train, color='red')  # Same regression line

plt.title("Salary vs Experience (Test Dataset)")
plt.xlabel("Years of Experience")
plt.ylabel("Salary (In Rupees)")
plt.show()
Output:
In this graph, the blue points represent the actual test data, while the red line is the same regression line learned from the training dataset. This allows us to visually compare the model’s predictions with unseen data.
Final Thoughts
Although Simple Linear Regression is a basic machine learning technique, it is very useful for understanding the fundamentals of regression. It provides a straightforward way to analyze relationships between variables and make predictions.
With Simple Linear Regression, you can:
- Understand relationships within data
- Make predictions using existing data
- Develop a foundation for learning more advanced machine learning models
When to Use Simple Linear Regression?
Simple Linear Regression can be considered when:
- You have one independent and one dependent variable
- The relationship between the variables is approximately linear
- You need a model that is simple and easy to interpret
Wrap-Up: What You Learned
In this guide, we covered:
- The concept of Simple Linear Regression
- Its mathematical formula and objectives
- How to implement Simple Linear Regression using Python
- How to visualize the regression results
Download New Real Time Projects :- Click here
After learning Simple Linear Regression, you can move toward more advanced regression techniques such as Multiple Linear Regression and Polynomial Regression, which are useful for working with multiple variables and non-linear relationships.
Have questions or feedback? Share your thoughts in the comments or continue exploring more practical machine learning tutorials.
Keywords: simple linear regression in machine learning, simple linear regression in machine learning example, simple linear regression in machine learning python code, simple linear regression in machine learning formula, simple linear regression in machine learning with example, simple linear regression in machine learning python, multiple linear regression in machine learning, logistic regression in machine learning, decision tree in machine learning