8 Types of Bias in Data Analysis
Data plays a critical role in modern decision-making. Organizations use data analysis to identify trends, understand customers, optimize operations, and make strategic decisions. However, data-driven decisions are only as reliable as the data, methods, and assumptions behind them.
One of the biggest challenges in data analysis is bias. Bias can enter at almost any stage of the analytical process—from data collection and sampling to model development, interpretation, and decision-making. If it is not identified and addressed, bias can produce misleading results and unfair outcomes.
“The first step is the realization that bias exists, not just in the data that is being analyzed or used, but also by the people who are using it.”
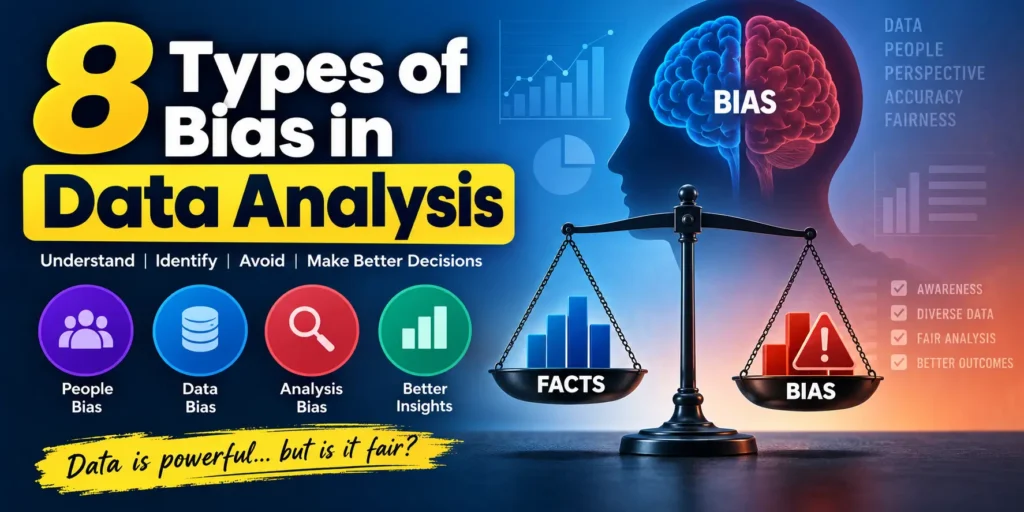
In this article, we will explore 8 common types of bias in data analysis, understand their impact, and discuss practical ways to reduce them.
Complete Advance AI Topics: Click Here
SQL Tutorial: Click Here
Why Is Bias Important in Data Analysis?
Bias can affect the quality and fairness of analytical results. A biased dataset or analytical process may cause organizations to:
- Make inaccurate business decisions
- Overlook important customer groups
- Build unreliable machine learning models
- Reinforce historical inequalities
- Misinterpret statistical relationships
- Produce unfair or discriminatory outcomes
Understanding the different forms of bias is therefore an important part of responsible data science, analytics, and artificial intelligence.
1. Recycling the Current Establishment
One type of bias occurs when analytical systems unintentionally reproduce existing patterns or structures. Historical data often contains the decisions and behaviors of the past. If those patterns are used without proper evaluation, a model can simply learn and reinforce them.
A well-known example involved an AI recruiting system developed by Amazon. The system reportedly learned from historical hiring data and developed preferences that disadvantaged female candidates. The problem was not necessarily that gender was directly used as a decision variable; instead, other features correlated with historical hiring patterns could influence the model.
This demonstrates how AI systems can unintentionally preserve existing inequalities when historical data is treated as automatically objective.
How to Avoid It
- Use explainable AI techniques whenever appropriate.
- Regularly audit models for unintended patterns.
- Compare model outcomes across relevant groups.
- Question whether historical patterns should actually be reproduced.
- Include domain experts when evaluating model behavior.
2. Training on the Wrong Objective
A model can perform well according to a statistical metric while failing to deliver meaningful business results. This happens when the objective used during model development does not accurately represent the real-world goal.
For example, a model may maximize overall accuracy while failing to identify the small percentage of cases that generate the greatest business value. In such situations, a model with slightly lower accuracy could potentially provide better real-world results.
The key lesson is that statistical performance and business value are not always the same thing.
How to Avoid It
- Clearly define the real-world objective before training the model.
- Connect model evaluation metrics with business outcomes.
- Consider the cost of false positives and false negatives.
- Measure return on investment where appropriate.
- Evaluate models using realistic business scenarios.
3. Under-Representing Populations
Under-representation occurs when certain groups are missing or inadequately represented in a dataset. This is closely related to selection bias and can have serious consequences when analytical results are applied to populations that were not properly represented in the original data.
For example, if a medical dataset primarily represents one demographic group, a model developed from that data may perform less effectively for other groups.
Similar problems can occur in customer analytics, hiring systems, financial services, education, and many other fields.
How to Avoid It
- Build diverse and representative datasets.
- Check dataset coverage before analysis.
- Evaluate model performance across different groups.
- Conduct regular bias audits.
- Include diverse perspectives within data and analytics teams.
- Provide appropriate bias-awareness training.
4. False Interpretation or Missing the Mark
Bias does not always originate in the dataset. Analysts themselves can introduce bias by interpreting information according to their existing assumptions or expectations.
For example, an analyst may search for evidence supporting an initial hypothesis while giving less attention to information that challenges it. This can turn data analysis from a process of discovery into a process of justification.
How to Avoid It
- Clearly define hypotheses before examining results.
- Consider evidence that contradicts the original assumption.
- Use independent reviews where possible.
- Segment datasets to uncover hidden patterns.
- Allow hypotheses to be disproved rather than only confirmed.
5. Statistical Bias
Statistical bias occurs when the methods used to collect, sample, or analyze data systematically produce results that differ from the true characteristics of the population.
A common example is relying on data that is easy to obtain rather than data that is representative of the population being studied. Convenience samples can be useful, but they may produce misleading conclusions when their limitations are ignored.
How to Avoid It
- Use appropriate sampling methods.
- Ensure the sample represents the target population.
- Regularly evaluate data quality.
- Refresh datasets when the underlying population changes.
- Monitor data pipelines for systematic errors.
- Document assumptions and limitations in analytical studies.
6. Analytics Bias from Incomplete Context
Analytics bias can occur when important information is missing or when data is analyzed without understanding its broader context.
A dataset may contain accurate numbers but still produce misleading insights if important variables, business conditions, customer behavior, or external factors are ignored.
For example, a decline in sales may appear negative when viewed independently, but additional context could reveal that the decline was caused by a deliberate move toward higher-value customers.
How to Avoid It
- Combine relevant datasets when appropriate.
- Understand the business context behind the numbers.
- Use data models that connect related information.
- Encourage collaboration between technical and business teams.
- Investigate what information may be missing from an analysis.
7. Confirmation Bias
Confirmation bias occurs when people give greater importance to information that supports their existing beliefs while ignoring or minimizing evidence that contradicts them.
This is one of the most common human biases in data analysis. Analysts may unknowingly select specific metrics, time periods, or datasets because they support a preferred conclusion.
As a result, analysis can become a way of confirming an existing belief rather than objectively evaluating the available evidence.
How to Avoid It
- Consider both supporting and opposing evidence.
- Define evaluation criteria before analyzing results.
- Use independent reviews of important analyses.
- Test models against multiple scenarios.
- Document assumptions and potential sources of bias.
- Introduce ethical and responsible AI review processes.
8. Outlier Bias
Outliers are unusually high or low observations that differ significantly from most other values in a dataset. While outliers can sometimes represent errors, they can also contain valuable information.
For example, imagine calculating the average income of a small group while including an extremely wealthy individual. The person’s income could dramatically increase the mean and make the result unrepresentative of the typical person in the group.
However, removing every outlier is not always appropriate. An unusual observation may represent an important event, a legitimate customer, fraud, or a change in behavior.
How to Avoid It
- Identify unusual observations during exploratory data analysis.
- Investigate why an outlier exists before removing it.
- Use the median when data is heavily skewed.
- Apply appropriate statistical techniques for extreme values.
- Distinguish between data errors and legitimate unusual observations.
How to Reduce Bias in Data Analysis
Bias cannot always be completely eliminated, but organizations can take practical steps to reduce its impact.
| Practice | Purpose |
|---|---|
| Use Representative Data | Ensure important populations and scenarios are adequately represented. |
| Audit Data | Identify missing, inaccurate, or systematically skewed information. |
| Review Assumptions | Challenge assumptions that may influence analytical conclusions. |
| Monitor Models | Detect changes in model performance and potential bias over time. |
| Use Explainability | Understand how models arrive at important predictions or decisions. |
| Include Diverse Perspectives | Reduce the risk of blind spots during data collection and analysis. |
YT:- DecodeIT
Conclusion
Bias is an important challenge in data analysis, machine learning, and artificial intelligence. It can enter through historical data, sampling methods, incomplete information, analytical assumptions, statistical techniques, or human interpretation.
The first step toward reducing bias is recognizing that it exists. Organizations should continuously evaluate their datasets, analytical processes, and models rather than assuming that data-driven decisions are automatically objective.
By using representative datasets, conducting regular audits, questioning assumptions, incorporating diverse perspectives, and aligning analytical objectives with real-world outcomes, organizations can produce more reliable and responsible insights.
Ultimately, effective data analysis is not simply about finding patterns in data. It is about understanding how the data was created, what it represents, what may be missing, and how the results should be interpreted.
Keywords
8 Types of Bias in Data Analysis, data analysis bias, types of data bias, statistical bias, confirmation bias, selection bias, outlier bias, analytics bias, AI bias, machine learning bias, data science bias, bias in machine learning, responsible AI, ethical data analysis, data analytics