R for Data Science
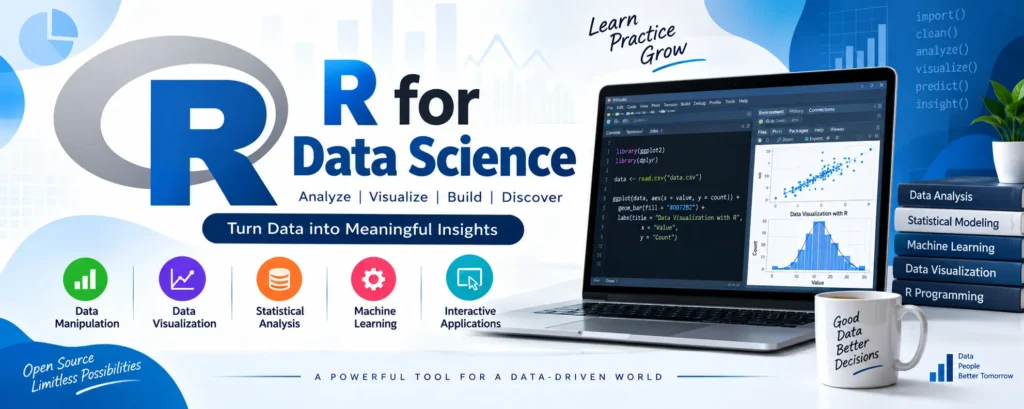
In today’s data-driven world, R is one of the most popular open-source programming languages for statistical computing, data analysis, and visualization. It is widely used by statisticians, analysts, researchers, and data scientists to turn raw data into meaningful insights.
R for Data Science provides a strong foundation for working with data. From data cleaning and visualization to statistical analysis and machine learning, R offers a wide range of tools and packages that support modern data science workflows.
Table of Contents
Complete Advance AI Topics: Click Here
SQL Tutorial: Click Here
Features of R for Data Science
R remains an important tool in data science because of its extensive statistical capabilities and rich package ecosystem.
- Advanced Statistical Modeling: R provides powerful tools for statistical analysis, hypothesis testing, regression, and model building.
- Rich Visualization Libraries: Libraries such as
ggplot2make it easy to create professional and publication-quality visualizations. - Efficient ETL Processes: R can connect with databases, spreadsheets, and other data sources for extracting, transforming, and loading data.
- Powerful Data Wrangling: Packages such as
dplyrandtidyrsimplify data cleaning and transformation. - Machine Learning: R supports many machine learning algorithms for classification, regression, clustering, and predictive modeling.
- Unstructured Data Support: R can work with data from NoSQL databases and other sources containing semi-structured or unstructured information.
Popular R Libraries for Data Science
1. dplyr
dplyr is one of the most widely used R packages for data manipulation. It provides simple and readable functions for working with datasets.
- select: Select specific columns.
- filter: Select rows based on conditions.
- arrange: Sort data.
- mutate: Create or modify variables.
- summarize: Calculate aggregated results.
It can work with both local data frames and remote database sources.
2. ggplot2
ggplot2 is one of R’s most popular visualization packages. Based on the Grammar of Graphics, it allows developers and analysts to create visualizations layer by layer.
It is particularly useful for exploring datasets, identifying patterns, and communicating analytical results through charts and graphs.
3. Esquisse
Esquisse provides an interactive, drag-and-drop approach to creating visualizations. It can make graph creation easier for users who prefer a visual interface and can also generate ggplot2 code for further customization.
4. tidyr
tidyr focuses on cleaning and organizing data into a tidy structure. In a tidy dataset, each variable is generally represented by a column and each observation by a row.
This structure makes datasets easier to analyze and work with using other R packages.
5. Shiny
Shiny allows developers to build interactive web applications directly with R. It is useful for creating dashboards, analytical applications, and interactive data exploration tools.
6. caret
caret, short for Classification And Regression Training, provides a unified interface for creating and evaluating machine learning models in R.
7. e1071
e1071 is a versatile R package that provides several machine learning and statistical tools, including Support Vector Machines (SVMs), Naive Bayes, and clustering functionality.
8. mlr3
mlr3 is a modern machine learning framework for R. It supports flexible workflows for tasks such as classification, regression, clustering, and survival analysis.
Applications of R in Real Life
R is used across different industries for statistical analysis, visualization, research, and predictive modeling.
- Google: R has been used for statistical analysis and exploring patterns in search-related data.
- Facebook: R has been used for analyzing user behavior and visualizing social network data.
- IBM: IBM has contributed to the R ecosystem and integrated R into analytics-related solutions.
- Uber: R and Shiny have been used to create interactive visualization and analytics tools.
- Airbnb: R can be used for predictive modeling and analyzing factors related to pricing and customer behavior.
Getting Started with R
Installation
To start learning R, install R from its official website. You can also use RStudio, a popular development environment that provides useful tools for writing and running R programs.
Learning Resources
R for Data Science by Hadley Wickham and Garrett Grolemund is a popular learning resource for understanding modern data science workflows with R.
Exploring and Importing Data
R provides several functions for importing and exploring datasets. Common functions include:
read.csv()
read.table()
head()
summary()
str()
These functions can help you load data and quickly understand its structure and contents.
Data Manipulation
Data manipulation is an important part of every data science project. Packages such as dplyr and tidyr can be used to clean, transform, filter, and organize datasets before analysis.
Data Visualization
With ggplot2, you can create different types of charts and graphs to explore relationships, trends, and patterns within your data.
Statistical Analysis
R provides extensive support for statistical analysis. You can perform tasks such as:
- Hypothesis testing
- Regression analysis
- ANOVA
- Descriptive statistics
- Statistical modeling
Machine Learning
R can also be used for machine learning. Beginners can start with frameworks such as caret and then explore packages such as randomForest, xgboost, and other machine learning libraries.
Reproducible Research
Tools such as R Markdown and Jupyter Notebooks can be used to document data analysis, combine code with explanations, and make analytical workflows easier to reproduce.
Future Trends and Challenges
Although R remains an important data science language, beginners and professionals should be aware of a few challenges.
- Performance Limitations: Extremely large datasets may require database integration or other technologies to improve performance.
- Learning Curve: Beginners without prior programming experience may need some time to become comfortable with R syntax.
- Large Package Ecosystem: The large number of available R packages can sometimes make it difficult to decide which tools are best suited for a particular project.
Despite these challenges, R continues to be a valuable and actively used technology within the data science ecosystem.
YT:- DecodeIT
Real-World Applications of R
Healthcare
R can be used for clinical trial analysis, genomics research, medical data analysis, and other healthcare-related applications.
Finance
Financial organizations can use R for risk modeling, credit scoring, fraud detection, financial analysis, and algorithmic trading research.
Marketing
R can help marketing teams analyze customer behavior, perform customer segmentation, predict churn, and evaluate campaign performance.
Environmental Science
Researchers use R for applications such as climate modeling, pollution analysis, environmental monitoring, and biodiversity studies.
Social Sciences
R is useful for analyzing survey data, studying behavioral patterns, performing statistical research, and analyzing social media data.
Sports Analytics
R can be applied to player performance analysis, injury prediction, team statistics, and tactical analysis.
Conclusion
R for Data Science is a powerful and flexible approach to analyzing data and generating useful insights. Its strong statistical capabilities, extensive package ecosystem, data manipulation tools, and visualization libraries make it an important technology for data professionals.
Whether you are working in healthcare, finance, marketing, environmental science, social sciences, or sports analytics, R provides tools that can help you understand data and build analytical solutions.
If you are planning to build a career in data science, learning R can provide a strong foundation in statistical analysis, visualization, data manipulation, and machine learning.
Stay tuned with UpdateGadh for more technology tutorials, data science guides, and practical insights.
Keywords
R for Data Science, R programming for data science, R data science tutorial, R programming, data science with R, R libraries for data science, dplyr, ggplot2, tidyr, Shiny, machine learning with R, R statistical analysis, R data visualization, R for data analysis, R programming tutorial