What is Data Analysis
In today’s information-driven world, data is often compared to the new oil. Just as crude oil needs to be refined before it becomes useful, raw data must also be processed and analyzed to unlock its real value. This is where data analysis plays an important role.
Data analysis has become an essential part of business, healthcare, education, research, and many other fields. But what exactly is data analysis, and why is it so important?
Table of Contents
Complete Advance AI Topics: Click Here
SQL Tutorial: Click Here
What is Data Analysis?
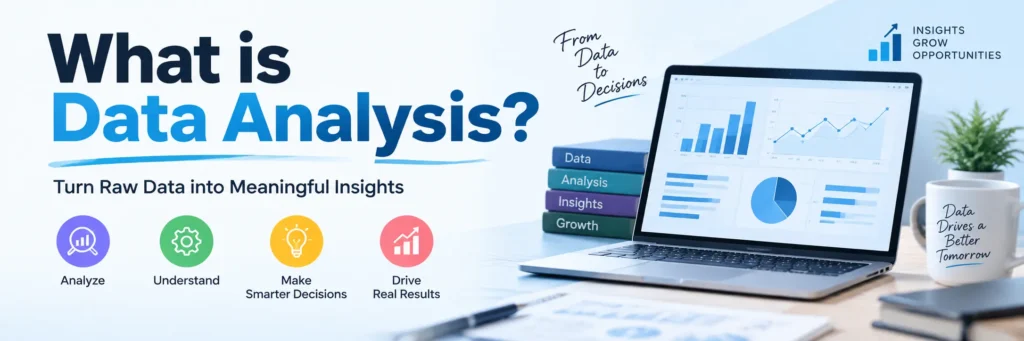
Data analysis is the process of examining, organizing, transforming, and interpreting raw data to turn it into meaningful information. It helps identify patterns, draw conclusions, and support informed decision-making.
By converting complex numbers into understandable visuals such as charts and graphs and applying statistical techniques, data analysis helps organizations and researchers discover hidden insights and important trends.
Whether the goal is to understand customer behavior, optimize resources, or forecast future trends, data analysis helps individuals and organizations make smarter, evidence-based decisions.
A Brief History of Data Analysis
The roots of data analysis can be traced back thousands of years. Over time, improvements in science, technology, and computing have transformed how data is collected and analyzed.
- Ancient Egypt: Used data-driven methods to track harvests and collect taxes.
- Ancient Greece: Applied early data interpretation techniques in areas such as astronomy and geometry.
- 17th Century: Innovations such as the telescope and microscope enabled more precise data collection and contributed to the development of modern statistics.
- 18th and 19th Centuries: Data analysis became increasingly important in scientific research and helped researchers understand various aspects of the universe.
- 20th Century: Computers and statistical software revolutionized data analysis by making large-scale data processing much faster and more efficient.
- Today: The growth of big data and the Internet of Things (IoT) has made data analysis more powerful and more important than ever.
Popular Tools for Data Analysis in Research
Different tools are used for data analysis depending on the requirements of a research project or business problem.
- Excel: Useful for basic data manipulation, charting, and pivot tables.
- SQL: Commonly used to manage and query large databases efficiently.
- Tableau: Used to create interactive dashboards and powerful data visualizations.
- Python: Widely used in data science with libraries such as NumPy, Pandas, and Matplotlib.
- R: Popular for statistical computing and data visualization using packages such as ggplot2 and dplyr.
- SAS: Provides powerful tools for statistical analysis and data management.
- SPSS: Commonly used for social science research, predictive modeling, and descriptive analysis.
Types of Data Analysis
There are several types of data analysis, and each serves a different purpose.
- Text Analysis: Analyzes unstructured text from sources such as emails, reviews, and social media. Techniques include sentiment analysis and topic modeling.
- Statistical Analysis: Uses statistical techniques to draw conclusions. Examples include regression analysis, ANOVA, and hypothesis testing.
- Diagnostic Analysis: Examines the causes behind patterns or unusual results using techniques such as root-cause and trend analysis.
- Predictive Analysis: Uses historical data, statistics, and machine learning to predict future outcomes, such as forecasting sales.
- Prescriptive Analysis: Recommends possible actions based on data analysis, optimization, and decision modeling.
The Data Analysis Process
The data analysis lifecycle generally consists of several important steps.
- Data Requirement Gathering: Define the problem and determine what data is required to solve it.
- Data Collection: Gather data from sources such as surveys, databases, sensors, or interviews.
- Data Cleaning: Remove inaccuracies, handle missing values, and standardize data formats.
- Data Analysis: Apply statistical methods and algorithms to identify patterns, trends, and correlations.
- Data Interpretation: Convert analytical results into meaningful and actionable insights.
- Data Visualization: Present the results using charts, graphs, and dashboards to make the findings easier to understand.
Real-World Applications of Data Analysis
Data analysis is used across many industries and plays an important role in improving decisions and processes.
Business Analytics
- Understand customer preferences.
- Improve marketing strategies.
- Optimize supply chains and increase profitability.
Healthcare Analytics
- Predict patient readmissions.
- Track disease outbreaks.
- Personalize treatment plans.
Education Analytics
- Identify students who may be at risk.
- Measure learning outcomes.
- Optimize resource allocation.
Social Media Analytics
- Measure brand sentiment.
- Track trending topics.
- Improve engagement strategies.
Sports Analytics
- Analyze player performance.
- Optimize training programs.
- Enhance fan engagement.
Benefits of Data Analysis
- Better Decision-Making: Decisions can be based on real data instead of assumptions.
- Improved Efficiency: Data analysis can help identify bottlenecks and optimize workflows.
- Competitive Advantage: Organizations can identify trends and adapt more quickly.
- Revenue Growth: Data can help uncover new markets and pricing opportunities.
- Enhanced Customer Experience: Services can be personalized according to customer behavior.
- Risk Management: Data analysis can help detect fraud and anticipate potential problems.
- Optimized Resource Allocation: Organizations can use resources where they are most effective.
Challenges in Data Analysis
Although data analysis provides many benefits, it also comes with several challenges.
- Data Quality Issues: Inaccurate or incomplete data can lead to incorrect conclusions.
- Data Security Concerns: Sensitive information needs to be protected from security breaches.
- Ethical Considerations: Responsible data usage should prioritize privacy and help avoid bias.
- Result Interpretation: Data does not explain everything by itself. Proper analysis and context are required to understand the results.
Generative Adversarial Network
Introduction
In the rapidly evolving field of deep learning, Generative Adversarial Networks, commonly known as GANs, are an important innovation. Introduced in 2014 by Ian J. Goodfellow, GANs changed how machines can generate new data by learning patterns from existing data.
GANs can be used to create realistic images of people who do not exist and can also be applied to areas such as paintings, music, and 3D objects.
What is a Generative Adversarial Network (GAN)?
A Generative Adversarial Network is a deep learning model made up of two neural networks that work against each other in a competitive learning process:
- Generator (G): Creates data that attempts to resemble real-world data such as images, text, or music.
- Discriminator (D): Examines data and attempts to determine whether a sample is authentic or generated.
These two components are trained together in what is known as a zero-sum game. The Generator attempts to fool the Discriminator, while the Discriminator tries to correctly identify generated data.
As training continues, the Discriminator becomes better at identifying fake data, while the Generator becomes better at producing realistic data.
Why Were GANs Invented?
Traditional neural networks can sometimes be vulnerable to small changes in input data, a weakness associated with adversarial attacks. GANs were introduced as a generative approach and can also be used to explore adversarial scenarios and model robustness.
In unsupervised learning, where labeled data may be limited, GANs can learn from data distributions without requiring labels, making them useful for various applications.
How Do GANs Work?
The working of GANs can be understood through three main concepts:
- Generative: The model learns the distribution of input data and uses it to produce new data.
- Adversarial: Two networks compete with each other during training and improve through this process.
- Network: Deep neural networks provide the foundation of the system.
Training Steps
- Use authentic data and generated data to train the Discriminator.
- Improve the Generator so that it can produce data capable of tricking the Discriminator.
- Repeat this process over many training iterations.
Eventually, the Generator can become good enough that the Discriminator has difficulty distinguishing between real and generated data.
YT:- DecodeIT
Example: Generating Images of Dogs
Suppose we want a GAN to generate realistic images of dogs.
1. Discriminator Training
- Provide real dog images along with fake dog images produced by the Generator.
- The Discriminator learns to classify the images as real or fake.
- Errors are calculated and used to improve its performance.
2. Generator Training
- Random noise is provided to the Generator.
- The Generator produces a dog-like image.
- The Discriminator evaluates the generated image.
- The Generator receives feedback about how realistic the image appears and improves its output.
With repeated training, the generated dog images can become increasingly realistic.
Mathematical Representation
The training of GANs follows a minimax game represented by the following formula:
V(D,G) = Eₓ~p_data(x)[log D(x)] + E_z~p_z(z)[log(1 - D(G(z)))]Where:
- D(x): Probability that the Discriminator predicts x as real.
- G(z): Output produced by the Generator from random input z.
- pdata(x): Real data distribution.
- pz(z): Prior distribution of the input noise variables.
Types of GANs
GANs come in different forms depending on their applications and complexity.
- Vanilla GAN: The basic GAN architecture uses multilayer perceptrons for the Generator and Discriminator.
- Conditional GAN (CGAN): Adds label information to the Generator and Discriminator, allowing conditional generation such as generating dogs or cats.
- Laplacian Pyramid GAN (LAPGAN): Generates high-quality images through multiple resolutions and networks.
- Super Resolution GAN (SRGAN): Enhances the resolution of low-quality inputs and can be used for image restoration.
- Deep Convolutional GAN (DCGAN): Uses convolutional layers to support more stable and high-quality generation.
Advantages of GANs
- High-Quality Output: GANs can generate highly realistic data, including faces and artwork.
- Unsupervised Learning: GANs can work without requiring labeled data.
- Synthetic Data Generation: Generated data can be useful when real training data is limited.
- Creative and Versatile: GANs can be applied across areas such as design, healthcare, and gaming.
Final Thoughts
Data analysis is about much more than simply working with numbers. It is the process of transforming information into meaningful insights. As the amount of available data continues to increase, the need for people who can analyze and understand that data also continues to grow.
From helping businesses improve their performance to supporting healthcare and education, data analysis has become an important part of modern decision-making. By using appropriate tools and techniques, organizations can develop smarter strategies, encourage innovation, and make more informed decisions.