
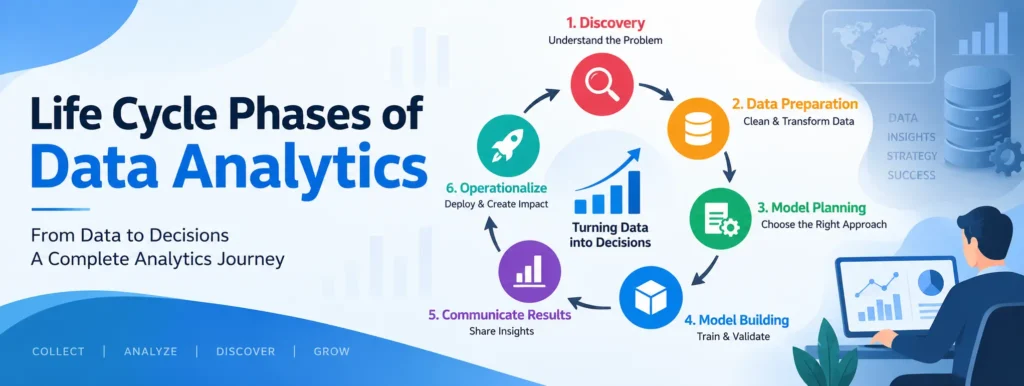
Life Cycle Phases of Data Analytics
In the world of data-driven decision-making, data analytics plays an important role in helping businesses, researchers, and organizations discover meaningful insights from large volumes of data. However, effective analytics does not happen with a single step. It follows a structured and strategic process known as the Data Analytics Life Cycle.
Table of Contents
Complete Advance AI Topics: Click Here
SQL Tutorial: Click Here
What Is the Data Analytics Life Cycle?
The Data Analytics Life Cycle is a step-by-step methodology used to solve Big Data problems and manage data science projects efficiently. It helps data teams plan, execute, analyze, and refine activities related to data acquisition, processing, analysis, and reuse.
It can be viewed as a roadmap that guides a project from identifying a business problem to developing and deploying a data-driven solution.
Phase 1: Discovery
Every successful analytics project begins by understanding the problem and asking the right questions.
During the discovery phase, the data science team:
- Becomes familiar with the business domain and the problem being addressed.
- Identifies potential data sources, including internal and external sources.
- Develops initial assumptions and hypotheses that can later be tested using data.
- Defines the project’s goals, success criteria, and deliverables.
This phase focuses on understanding the project scope and establishing a strong foundation for the remaining stages.
Phase 2: Data Preparation
The data preparation phase, often called data wrangling, focuses on converting raw data into a usable format for analysis.
Important activities include:
- Cleaning, transforming, and integrating data from different sources.
- Creating an analytic sandbox where the team can safely explore and experiment with the data.
- Handling missing values, duplicate records, and inconsistent data formats.
Tools such as Hadoop, Alpine Miner, and OpenRefine can be used during data preparation.
Data preparation is generally an iterative process. Teams may need to repeat cleaning and transformation tasks several times before the data is ready for modeling.
Phase 3: Model Planning
Once the data has been prepared, the team begins planning the analytics model and determining the most appropriate analytical approach.
This phase includes:
- Exploring relationships between variables.
- Selecting suitable data modeling techniques.
- Choosing algorithms and designing analytical workflows.
- Structuring datasets for training and testing.
- Defining an overall analytical strategy.
Tools such as MATLAB and STATISTICA can be used for data visualization, statistical analysis, and model planning.
Phase 4: Model Building
After establishing the modeling strategy, the team moves to building the actual model.
The major activities in this phase include:
- Training the model using prepared data.
- Validating and testing the model.
- Evaluating whether the available infrastructure can support the computational requirements.
- Fine-tuning parameters to improve model performance.
- Optimizing the model based on evaluation results.
Common tools used during model building include:
- Free/Open Source: R, PL/R, Octave, WEKA
- Commercial: MATLAB, STATISTICA
Model building combines technical analysis with experimentation to create a solution that can effectively address the original problem.
Phase 5: Communicate Results
Once the model has been developed and evaluated, the results need to be communicated clearly to stakeholders. This is where data storytelling becomes important.
The team should:
- Analyze the results and measure performance against the original objectives.
- Identify important findings and explain their business value.
- Prepare presentations, dashboards, and visualizations to communicate insights.
- Explain important assumptions and limitations.
- Identify appropriate next steps based on the findings.
Effective communication is not simply about creating attractive charts. The goal is to help stakeholders understand the findings and use them to make informed decisions.
YT:- DecodeIT
Phase 6: Operationalize
The final phase focuses on putting the analytics solution into practical use and making its benefits available across the organization.
The operationalization process may include:
- Launching a pilot to evaluate the solution in a controlled real-world environment.
- Evaluating the model’s performance, scalability, and impact.
- Making necessary adjustments before a full-scale rollout.
- Preparing final documentation, presentations, and deployment scripts.
Tools such as WEKA, SQL, Octave, and MADlib can be used to support implementation and monitoring activities.
Wrapping Up
The Data Analytics Life Cycle is more than a checklist. It is a structured framework that helps ensure every stage of a data analytics project is purposeful and aligned with business objectives.
From discovering the right problem and preparing data to building models, communicating insights, and operationalizing the final solution, each phase contributes to the overall success of the analytics journey.
Understanding these phases helps organizations transform raw data into meaningful insights and ultimately turn those insights into better decisions.
Keywords
Life Cycle Phases of Data Analytics, Data Analytics Life Cycle, data analytics life cycle phases, data science life cycle, Big Data analytics, data analytics process, data preparation, model planning, model building, communicate results, operationalize, data wrangling, data analytics with examples, data analytics life cycle diagram