
Data Types in Statistics
Understanding data types in statistics is one of the first steps toward effective statistical analysis. Whether you are working with survey responses, medical records, business information, or financial data, identifying the type of data correctly helps you select appropriate statistical methods and make accurate conclusions.
In statistics, data is commonly classified into four primary types: nominal, ordinal, discrete, and continuous. These types are generally grouped into two broader categories: qualitative (categorical) and quantitative (numerical) data.
Correctly identifying data types improves the accuracy of analysis and helps researchers and analysts produce meaningful results across areas such as healthcare, business, education, technology, and research.
Complete Advance AI Topics: Click Here
SQL Tutorial: Click Here
What is Data?
Data refers to raw facts, observations, measurements, or information collected for analysis. By itself, raw data may not provide much meaning, but once it is organized, processed, and interpreted, it can be used to identify patterns and support decision-making.
Data can be broadly classified as:
- Structured Data: Data organized in a predefined format, such as spreadsheets, tables, or databases.
- Unstructured Data: Data that does not follow a fixed structure, such as images, videos, documents, and free-form text.
For example, businesses can use customer data to understand purchasing behavior, while financial analysts can use market data to identify trends and make informed decisions.
Types of Data in Statistics
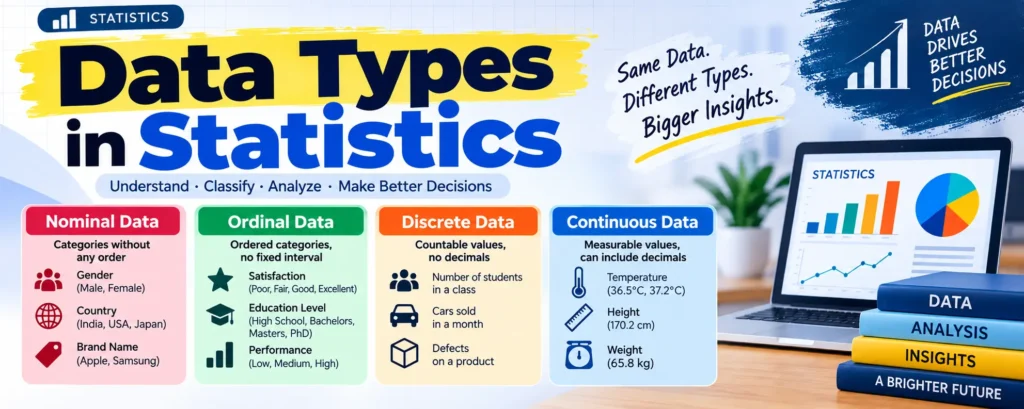
Classifying data correctly is important because different types of data require different statistical techniques and methods of visualization. The four primary types of data in statistics are nominal, ordinal, discrete, and continuous.
1. Qualitative Data (Categorical Data)
Qualitative data, also called categorical data, describes characteristics, labels, or categories rather than measurable numerical quantities. It is mainly used to represent attributes or groups.
Qualitative data is commonly divided into two types:
Nominal Data
Nominal data represents categories that do not have any specific order or ranking. The categories are simply different labels.
Examples of nominal data include:
- Gender: Male, Female
- Blood Type: A, B, AB, O
- Country: India, USA, Japan
- Eye Color: Brown, Blue, Green
- Brand Name: Apple, Samsung, Sony
Nominal categories can sometimes be represented using numbers. For example, Male = 1 and Female = 2. However, these numbers are only labels and do not have mathematical meaning.
Nominal data is often summarized using frequency counts, percentages, bar charts, and pie charts.
Ordinal Data
Ordinal data represents categories that have a meaningful order or ranking. However, the difference between two consecutive categories is not necessarily equal.
Examples of ordinal data include:
- Customer satisfaction: Poor, Fair, Good, Excellent
- Education level: High School, Bachelor’s, Master’s, PhD
- Performance rating: Low, Medium, High
- Service quality: Bad, Average, Good, Excellent
Ordinal data can be ranked, but we cannot assume that the distance between categories is equal. For example, the difference between Good and Excellent may not be the same as the difference between Fair and Good.
Depending on the analysis, ordinal data may be evaluated using non-parametric statistical methods such as the Mann-Whitney U test and Kruskal-Wallis test.
2. Quantitative Data (Numerical Data)
Quantitative data represents numerical values that can be counted or measured. It is useful when performing mathematical and statistical calculations.
Quantitative data is divided into two main types:
Discrete Data
Discrete data consists of countable values. It usually represents whole numbers and is produced by counting individual items or events.
Examples of discrete data include:
- Number of students in a class
- Number of cars sold in a month
- Number of defects in a product
- Number of calls received by a company
- Number of products sold
For example, a store may sell 25 products in one day. It would not normally sell 25.5 products, which makes the number of products sold a discrete variable.
Discrete data can be presented using bar charts, frequency tables, and other categorical or count-based visualizations.
Continuous Data
Continuous data represents measurable values that can take any value within a given range. Unlike discrete data, continuous data can include decimals and fractions.
Examples of continuous data include:
- Temperature: 36.5°C, 37.2°C
- Height: 170.2 cm
- Weight: 65.8 kg
- Time: 12.45 seconds
- Distance: 15.75 km
Because continuous data can take many possible values within a range, it is commonly analyzed using techniques such as standard deviation, regression analysis, and histograms.
Summary Table of Data Types
| Data Type | Category | Characteristics | Examples |
|---|---|---|---|
| Nominal | Qualitative | Categories without order | Gender, Eye Color, Brand Name |
| Ordinal | Qualitative | Ordered categories without fixed intervals | Satisfaction Rating, Education Level |
| Discrete | Quantitative | Countable values, generally whole numbers | Number of Calls, Products Sold |
| Continuous | Quantitative | Measurable values that can include decimals | Time, Temperature, Height, Weight |
Why Data Types Matter in Statistics
Identifying the correct data type in statistics is important because the type of data determines which statistical methods and visualizations are appropriate.
- Choosing statistical tests: Different data types require different statistical techniques.
- Selecting visualizations: Categorical data can be displayed using bar charts, while continuous data can often be represented using histograms.
- Improving accuracy: Correct classification reduces the risk of using inappropriate analytical methods.
- Better interpretation: Understanding the structure of data helps analysts draw more meaningful conclusions.
For example, calculating the average of a nominal variable such as car color does not make statistical sense. Similarly, treating ordinal categories as though their intervals are always equal can produce misleading results.
Qualitative vs Quantitative Data
The four primary data types can be remembered by grouping them into two major categories:
- Qualitative Data: Nominal + Ordinal
- Quantitative Data: Discrete + Continuous
Qualitative data mainly describes categories and characteristics, whereas quantitative data represents numerical quantities that can be counted or measured.
YT:- DecodeIT
Conclusion
Understanding data types in statistics is essential for anyone working with data. From customer preferences and education levels to sales figures, temperature, and measurements, each type of data has a specific role in statistical analysis.
The four primary types are nominal, ordinal, discrete, and continuous. Nominal and ordinal data belong to qualitative data, while discrete and continuous data belong to quantitative data.
Once you correctly identify the type of data, it becomes easier to select appropriate statistical methods, create meaningful visualizations, and interpret results accurately. This makes data classification an important foundation for statistics, data analysis, machine learning, and research.
Keywords
data types in statistics, types of data in statistics, 4 types of data in statistics, qualitative and quantitative data, nominal data, ordinal data, discrete data, continuous data, types of data in statistics with examples, what is data in statistics, data types in statistics analysis, classification of data in statistics, primary data types in statistics, secondary data types in statistics, quantitative data types in statistics, qualitative data types in statistics, measures of central tendency, standard deviation