Basic Statistics Concepts for Data Science
Data science focuses on extracting meaningful insights from data, and statistics provides the foundation for this process. From predicting trends and identifying patterns to evaluating model accuracy, statistical concepts are used throughout data science.
In this article, we will explore the fundamental statistics concepts every aspiring data scientist should understand. These concepts help you analyze data, build reliable models, and make informed decisions based on evidence.
Complete Advance AI Topics: Click Here
SQL Tutorial: Click Here
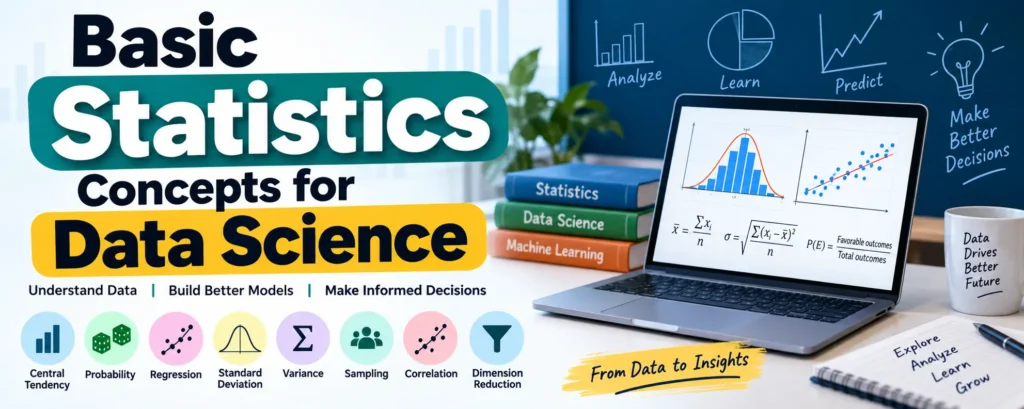
Key Statistics Concepts for Data Science
- Central Tendency
- Probability
- Regression
- Standard Deviation
- Variance
- Sampling
- Correlation
- Dimension Reduction
1. Central Tendency
Central tendency describes the center or typical value of a dataset. The three most common measures are mean, median, and mode.
Mean
The mean is the average of all values in a dataset.
Formula:
Mean = Sum of all values / Number of valuesMedian
The median is the middle value when the data is arranged in ascending or descending order.
- For an odd number of values, the middle position is (n + 1) / 2.
- For an even number of values, the median is the average of the two middle values.
Mode
The mode is the value that occurs most frequently in a dataset.
2. Probability
Probability measures how likely an event is to occur. It is widely used in prediction, risk assessment, diagnostics, and other data science applications.
Formula:
P(E) = Number of favorable outcomes / Total number of outcomesTypes of Probability
- Theoretical Probability: Based on logical reasoning and mathematical possibilities.
- Experimental Probability: Based on results obtained from actual experiments.
- Axiomatic Probability: Based on a defined set of mathematical rules or axioms.
3. Regression
Regression is a statistical technique used to understand the relationship between dependent and independent variables. It is particularly important for prediction and forecasting tasks in data science.
Linear Regression
Linear regression is used when the relationship between variables can be represented approximately by a straight line.
Formula:
y = mx + c + eLogistic Regression
Logistic regression is commonly used when the outcome is categorical, such as yes/no or 0/1.
Sigmoid Function:
f(x) = 1 / (1 + e^-x)Polynomial Regression
Polynomial regression uses polynomial terms to model relationships that are not adequately represented by a straight line.
4. Standard Deviation
Standard deviation measures how much individual data points differ from the mean of a dataset.
- A low standard deviation means that values tend to remain close to the mean.
- A high standard deviation means that values are more widely dispersed.
Standard deviation is useful for understanding variability, consistency, and risk within a dataset.
5. Variance
Variance measures how far data points are spread from the mean. It is the square of the standard deviation.
Formula:
Variance = Σ(xi - x̄)² / NVariance is useful in areas such as model evaluation, understanding variability, and analyzing the bias-variance tradeoff. It can also help identify problems related to overfitting and underfitting.
6. Sampling
Sampling involves selecting a smaller subset from a larger population or dataset. Instead of analyzing every data point, a representative sample can be used to draw conclusions about the larger population.
Sampling is especially useful when working with large datasets where analyzing the entire population may be inefficient.
Common Sampling Techniques
- Random Sampling: Every element has an equal chance of being selected.
- Stratified Sampling: The population is divided into groups, and samples are selected from each group.
- Cluster Sampling: The population is divided into clusters, and complete clusters are selected randomly.
- Systematic Sampling: Data points are selected at regular intervals, such as every nth element.
- Convenience Sampling: Samples are selected based on ease of access.
- Quota Sampling: A specific number of observations is selected from each category.
7. Correlation
Correlation measures the strength and direction of the relationship between two variables.
Pearson Correlation Coefficient
The Pearson correlation coefficient, represented by r, describes the linear relationship between two variables.
- r = 1: Perfect positive correlation
- r = -1: Perfect negative correlation
- r = 0: No linear correlation
Formula:
r = Σ(xi - x̄)(yi - ȳ) / √[Σ(xi - x̄)² × Σ(yi - ȳ)²]Understanding correlation is important for tasks such as feature selection, data exploration, and hypothesis testing.
8. Dimension Reduction
Datasets with a very large number of variables can become difficult to analyze and may suffer from the curse of dimensionality. Dimension reduction techniques simplify datasets by reducing the number of variables while retaining important information.
Common Dimension Reduction Methods
- PCA (Principal Component Analysis)
- t-SNE (t-Distributed Stochastic Neighbor Embedding)
These techniques can make complex datasets easier to analyze and visualize while helping improve model efficiency and interpretability.
Download New Real-Time Projects: Click here
Conclusion
Learning the basics of statistics is an important step toward becoming a successful data scientist. Statistical concepts help you analyze data, identify patterns, build predictive models, and make decisions based on evidence.
From central tendency and probability to regression, correlation, sampling, and dimension reduction, these concepts provide a strong foundation for understanding and working with data.
Keep learning and exploring statistics to strengthen your data science skills.
Keywords
statistics concepts for data science, statistics for data science, basic statistics concepts, statistics in data science, statistics concepts, data science statistics, probability in data science, regression in data science, standard deviation, variance, sampling techniques, correlation in data science, dimension reduction, PCA, t-SNE, practical statistics for data science