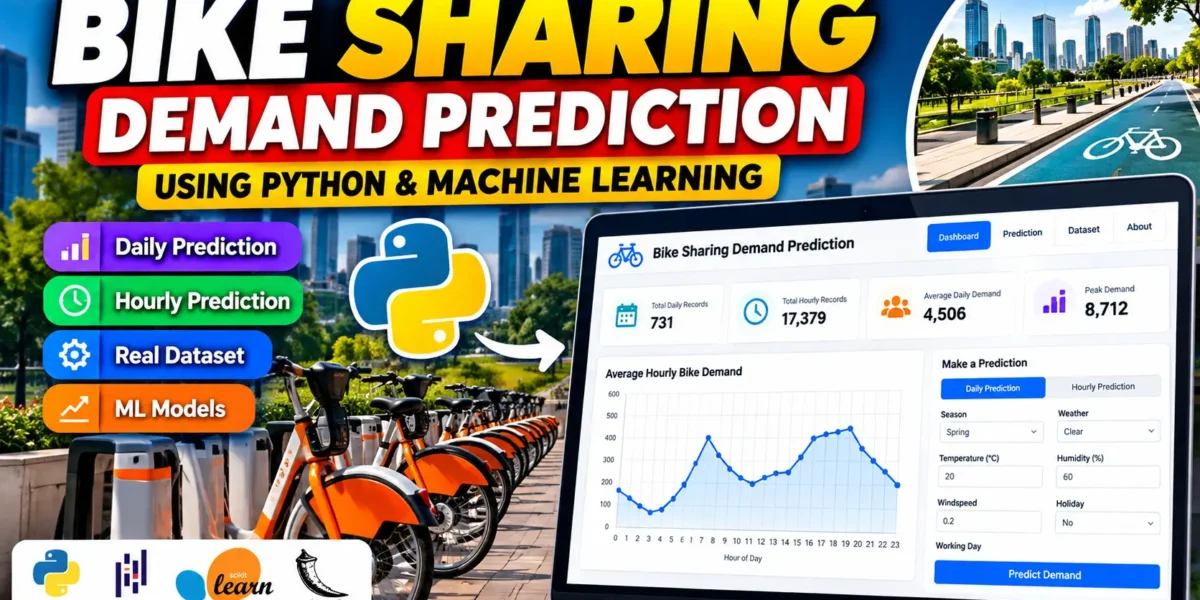
Bike Sharing Demand Prediction Using Python and Machine Learning
Bike Sharing Demand Prediction is a practical machine learning project designed to estimate how many bicycles may be rented under different environmental and calendar conditions. Modern bike-sharing services depend on the right number of bicycles being available at the right time and location. If demand is underestimated, users may find stations empty; if it is overestimated, operators may keep too many bicycles in low-demand areas. A prediction system can therefore support better planning and more efficient use of available bicycles.
This medium-level college project uses Python, Pandas, NumPy, Scikit-learn, Flask and CSV datasets to create a complete prediction workflow. It supports both daily and hourly demand analysis. The application combines a professional dashboard with trained regression models, dataset insights and a prediction form, making it suitable for students who want to understand how a real machine learning application can move from data preparation to a usable web interface.
Complete Advance AI Topics: Click Here
Real Time Projects on YouTube:- DecodeIT
Project Overview
| Attribute | Details |
|---|---|
| Project Name | Bike Sharing Demand Prediction |
| Language Used | Python |
| Framework | Flask |
| Libraries | Pandas, NumPy, Scikit-learn, Joblib |
| Database | CSV Dataset Files |
| Type | Machine Learning / Data Science Project |
Key Features
- Daily Demand Prediction: The daily model estimates overall bicycle rentals using weather, seasonal and calendar-related inputs.
- Hourly Demand Prediction: The hourly model includes the hour of the day so that demand patterns can be examined at a finer level.
- Pre-Trained Models: The project contains deployed model files for daily and hourly prediction, while
train_models.pycan retrain them. - Data Analysis: The dashboard presents an hourly demand chart and summary statistics from the available datasets.
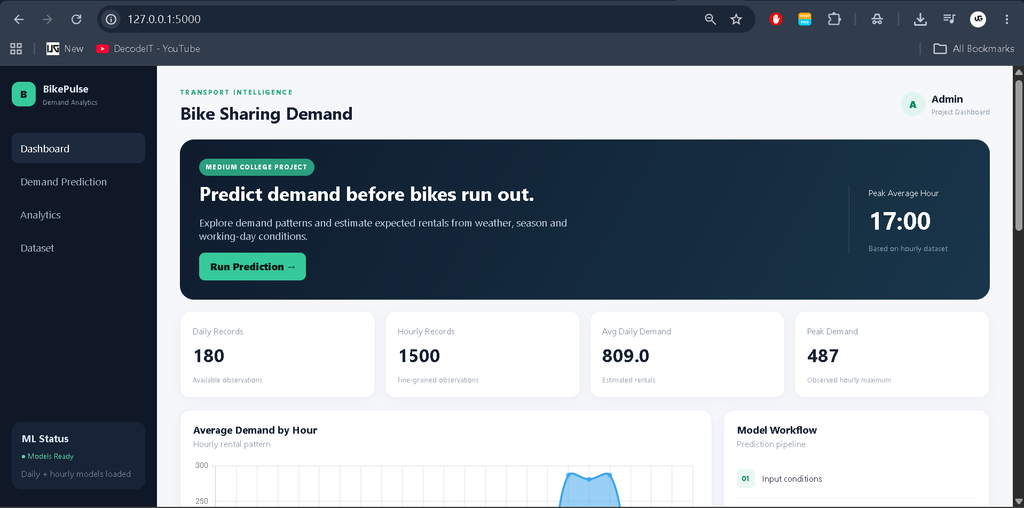
- Professional Dashboard: A responsive Flask interface provides KPI cards, navigation, a demand chart, model workflow information and a prediction form.
- Input Validation: Prediction fields use suitable ranges and selections for weather, season, temperature, humidity, windspeed and calendar conditions.
- Deployment Files: The project includes
Procfileandsetup.shto support common deployment workflows.
Dataset
The project works with two CSV files. day.csv represents daily observations, while hour.csv provides observations at hourly granularity. The datasets contain variables such as season, weather situation, temperature, humidity, windspeed, holiday status, working-day status and rental count. The hourly file also contains an hour field, which allows the application to identify changes in demand during the day.
The included files are compact demonstration datasets shaped for the application workflow, so the project can be executed immediately. Students can replace them with a compatible bike-sharing dataset for further academic experimentation while keeping the expected column structure.
Technologies Used
- Python: Main programming language for data processing, model training and application logic.
- Flask: Connects the machine learning functionality with the web dashboard.
- Pandas: Loads and prepares the CSV datasets.
- NumPy: Handles numerical prediction inputs.
- Scikit-learn: Provides preprocessing, regression algorithms and evaluation metrics.
- Joblib: Saves and loads trained machine learning pipelines.
- HTML/CSS/JavaScript: Builds the responsive dashboard and prediction interface.
Machine Learning Models
The daily workflow uses a Gradient Boosting Regressor, while the hourly workflow uses a Random Forest Regressor. These models are trained as regression pipelines. Categorical variables are encoded, numerical variables are scaled, and the processed features are passed to the selected estimator. The separation between daily and hourly models keeps the workflow easy to understand while still demonstrating two practical regression approaches.
The training script divides each dataset into training and testing portions. It then reports R² Score and Root Mean Squared Error (RMSE). R² describes how much variation in the target is explained by the model, while RMSE expresses prediction error in the same general unit as the demand value. These metrics help students inspect model performance rather than relying only on a prediction screen.
Project Modules
1. Dashboard Module
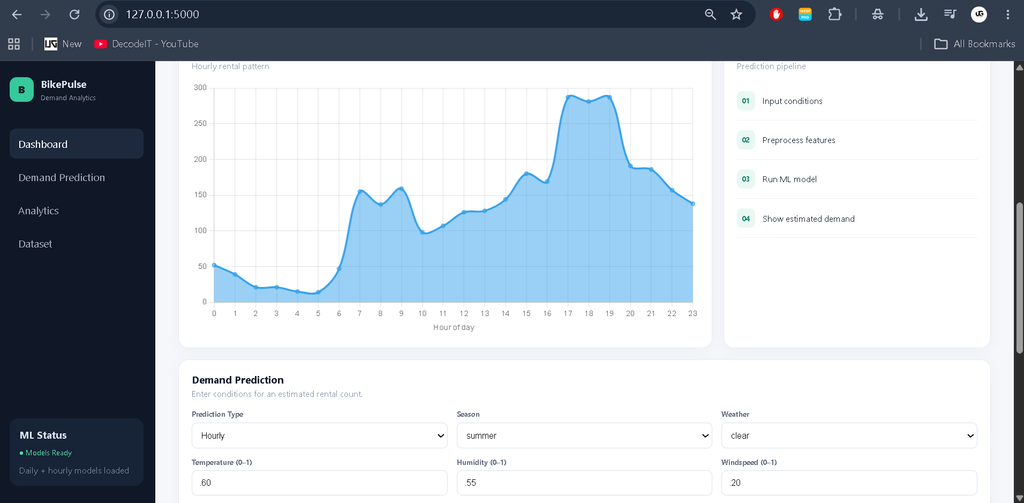
The dashboard provides an overview of daily records, hourly records, average daily demand and peak observed demand. A line chart displays average rentals by hour, making it easier to identify periods with relatively higher activity.
2. Prediction Module
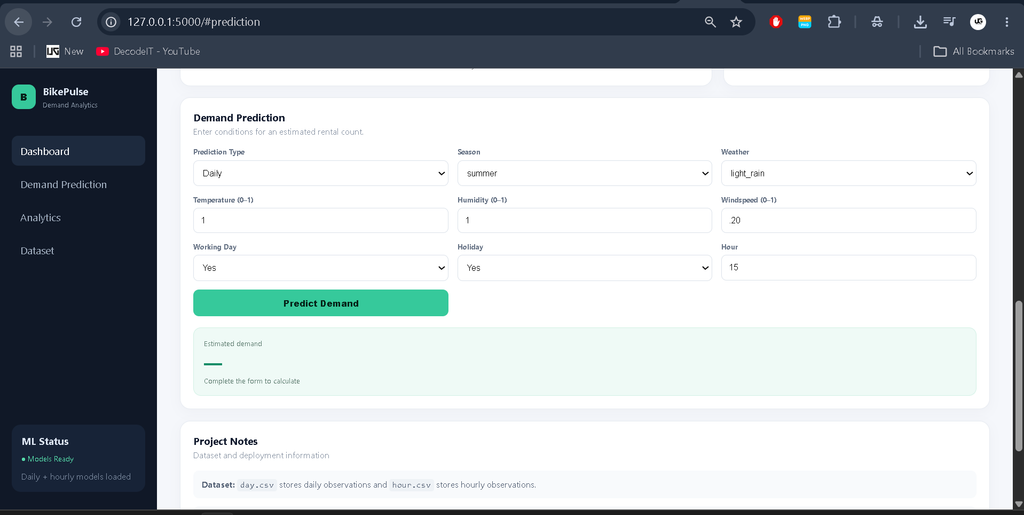
Users can select daily or hourly prediction and provide environmental and calendar conditions. For hourly prediction, the hour of the day is also supplied. The Flask backend converts the submitted values into the feature structure expected by the selected trained model and returns an estimated rental count.
3. Dataset Module
The application reads the daily and hourly CSV files directly. This keeps the project straightforward for college students and makes it easy to inspect or replace the data during experimentation.
4. Model Training Module
The train_models.py file handles preprocessing, model training, evaluation and model storage. Running it refreshes the saved model files used by the dashboard.
How the System Works
The workflow starts when the application loads the datasets and trained models. A user selects the required prediction type and enters conditions such as season, weather, temperature, humidity, windspeed, holiday status and working-day status. For hourly prediction, the selected hour is also included. The browser sends the values to the Flask prediction endpoint. The backend prepares the feature array, loads the appropriate model and calculates the estimated demand. The result is then displayed immediately on the dashboard.
Download complete source code
Screenshot
Installation and Setup
Extract the project ZIP file and open the folder in Visual Studio Code. Create a virtual environment and activate it.
python -m venv venv
venv\Scripts\activate
On macOS or Linux, use:
source venv/bin/activateInstall the required packages:
pip install -r requirements.txtTrain or refresh the machine learning models:
python train_models.pyStart the Flask application:
python app.pyOpen http://127.0.0.1:5000 in a browser to access the dashboard.
Usage
After opening the dashboard, review the KPI cards and hourly demand chart to understand the available data. Go to the prediction section, select daily or hourly mode, enter the requested conditions and click Predict Demand. The application displays the estimated number of bike rentals. Students can also edit the CSV files and rerun the training script to study how different data affects model performance.
Frequently Asked Questions
What is the purpose of this project?
It predicts bike rental demand from historical environmental and calendar-related information.
Does the project support both daily and hourly prediction?
Yes. Separate trained models are provided for daily and hourly demand estimation.
Which framework is used for the web application?
The dashboard is built with Flask and uses HTML, CSS and JavaScript for the interface.
Which files contain the datasets?
day.csv contains daily observations and hour.csv contains hourly observations.
Can the models be trained again?
Yes. Run python train_models.py after preparing a compatible dataset.
Is a database server required?
No. This version uses CSV files as the project data source, keeping setup simple for a college environment.
Future Scope
- Use a larger real-world bike-sharing dataset covering more locations and longer time periods.
- Add station-level demand analysis when station information is available.
- Compare additional regression algorithms and tune their parameters.
- Add downloadable prediction and summary reports.
- Introduce scheduled model retraining when new historical data becomes available.
Conclusion
The Bike Sharing Demand Prediction project demonstrates how machine learning can be connected to a practical transportation problem. By combining daily and hourly datasets, regression models, evaluation metrics and a professional Flask dashboard, the system gives students a complete view of a machine learning application workflow. It also remains understandable and manageable at the college-project level. The project can be extended gradually with better datasets, additional analysis and improved prediction techniques without changing its core purpose.
Bike Sharing Demand Prediction
Bike Sharing Demand Prediction – Google Search
bike sharing demand prediction challenge
bike sharing demand prediction project
bike sharing demand prediction github
bike sharing demand prediction dataset
bike sharing demand prediction kaggle
seoul bike sharing demand prediction
bike sharing demand prediction python
bike sharing demand prediction model