Reduction of ER Diagram to Table
An Entity-Relationship (ER) diagram provides a visual representation of a database structure, showing entities, attributes, and relationships. To implement this design in a relational database, the ER diagram is converted into relational tables. This process is known as the reduction of an ER diagram to table format. The following steps explain the key rules involved in this conversion process.
Table of Contents
Complete Advance AI Topics: Click Here
SQL Tutorial: Click Here
Conversion Rules
1. Entity Types Become Tables
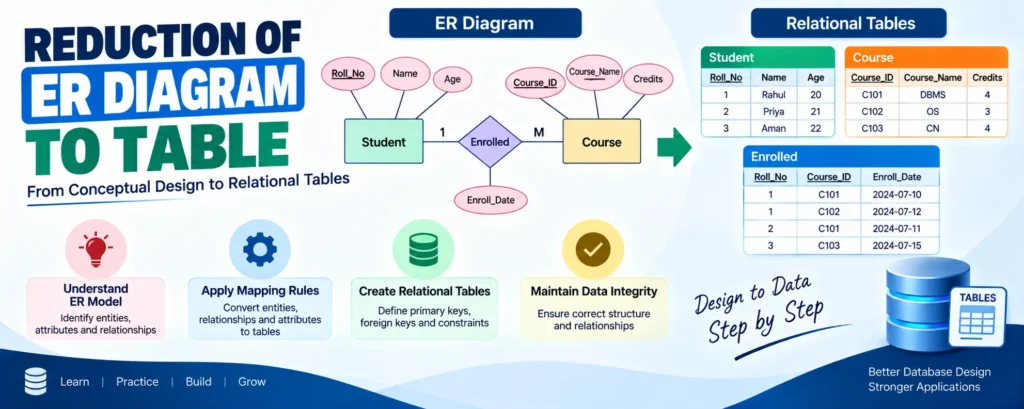
Each entity set in an ER diagram is converted into a separate table. For example, LECTURE, STUDENT, SUBJECT, and COURSE are represented as individual tables.
2. Single-Valued Attributes Become Columns
Each single-valued attribute of an entity is converted into a column in its corresponding table. For example, the STUDENT entity may have columns such as STUDENT_ID and STUDENT_NAME.
3. Key Attributes Become Primary Keys
The key attribute that uniquely identifies each row becomes the primary key (e.g., STUDENT_ID, COURSE_ID).
4. Multivalued Attributes Need Separate Tables
A multivalued attribute like HOBBY needs its own table STUD_HOBBY with STUDENT_ID + HOBBY forming a composite primary key.
5. Composite Attributes Are Split
A composite attribute like ADDRESS is split into atomic columns: DOOR#, STREET, CITY, STATE, PIN.
6. Derived Attributes Are Not Stored
Derived attributes like AGE (calculated from DATE_OF_BIRTH) are not stored as columns.
Download New Real Time Projects:- Click here
Conclusion
Following these steps reduces an ER diagram to a set of normalized relational tables, preserving data integrity and enabling efficient querying. For more foundational database concepts, stay tuned with .
er diagram to table conversion examples
er diagram to table conversion pdf
reducing er diagram to relational schema
er diagram to table questions
reduction of er diagram to table example
extended er model
how to find number of tables from er diagram
reduction of er diagram to table dbms