Data Analysis Tools
In today’s data-driven world, data analysis tools have become essential for extracting meaningful and actionable insights from large datasets. From beginner-friendly spreadsheet software such as Microsoft Excel to powerful programming languages like Python and R, there are tools available for everyone, from complete beginners to experienced professionals.
As industries increasingly move toward data-driven decision-making, the demand for skilled data analysts continues to grow. Learning the right tools can help professionals understand and visualize complex data, solve problems efficiently, and support better business decisions.
This guide by UpdateGadh covers essential data analysis tools, their uses, important concepts, visualization platforms, and advanced machine learning technologies.
Table of Contents
Complete Advance AI Topics: Click Here
SQL Tutorial: Click Here
Why Is Data Analysis Important?
Data analysis plays an important role in decision-making in today’s information-rich world. Businesses, governments, and organizations rely on data to:
- Make strategic decisions
- Optimize business operations
- Improve customer experiences
- Identify trends and patterns
- Support innovation
In industries such as healthcare, finance, marketing, and public policy, data analysis helps uncover patterns, trends, and relationships that may otherwise remain hidden. As the amount of available data continues to increase, the ability to analyze it effectively has become essential for maintaining a competitive advantage.
How to Pick the Best Tools for Data Analysis
Choosing the right data analysis tool depends on several factors, including your goals, technical skills, budget, and existing technology environment.
1. Define Your Goals and Requirements
First, determine what type of analysis you need. This could include descriptive, predictive, or prescriptive analysis. You should also identify industry-specific requirements, such as real-time data integration, advanced statistics, or machine learning capabilities.
2. Understand Skill Levels
Select a tool that matches the technical skills of its users. Beginners may prefer simple and user-friendly tools such as Excel or Power BI, while experienced analysts and data scientists may choose programming-based tools such as Python or R.
3. Integration and Compatibility
Make sure the selected tool works well with your existing databases, applications, and data sources. Good integration can improve data sharing and create a more efficient analysis workflow.
4. Budget Considerations
Consider the total cost of acquisition, training, subscriptions, and maintenance. Open-source tools such as Python and R are freely available, while commercial platforms such as Tableau and SAS may require paid licenses or subscriptions.
5. Explore Free Trials and Reviews
Before selecting a tool, explore available free trials, documentation, and user reviews. Testing a tool in a real or sample project can help you understand its features and limitations.
Basic Concepts in Data Analysis
Data and Variables
Data represents information collected for analysis. Variables are specific characteristics or measurements within a dataset, such as age, salary, product type, or sales amount.
Descriptive Statistics
Descriptive statistics provide basic summaries of a dataset. Common measures include the mean, median, mode, and standard deviation.
Types of Data
- Nominal: Categories without a specific order, such as product type.
- Ordinal: Categories with a meaningful ranking, such as low, medium, and high.
- Interval: Numeric data where differences are meaningful but there is no true zero, such as temperature in Celsius.
- Ratio: Numeric data with a meaningful zero, such as income or weight.
Sampling
Sampling involves selecting a subset of data from a larger population. Analysts can use the sample to make informed conclusions about the overall population.
Probability
Probability measures the likelihood of an event occurring and is an important foundation for statistical analysis and modeling.
Data Visualization
Charts, graphs, and dashboards make complex datasets easier to understand. Visualization helps analysts identify trends, patterns, and unusual values.
Correlation vs. Causation
Correlation indicates that two variables are related, while causation means that a change in one variable directly produces a change in another. Correlation alone does not prove causation.
Beginning to Analyze Data Using Python
Python is one of the most flexible programming languages for data analysis. Its large ecosystem provides libraries for data manipulation, numerical computing, visualization, and machine learning.
- Pandas: Data manipulation and analysis
- NumPy: Numerical operations and scientific computing
- Matplotlib: Data visualization
- Seaborn: Statistical data visualization
Python can be used for tasks such as data cleaning, exploratory analysis, visualization, statistical analysis, and machine learning. Its large community, extensive documentation, and educational resources also make it a popular choice for beginners and professionals.
R Programming for Statistical Analysis
R is a programming language designed particularly for statistics, data analysis, and visualization. It is widely used in academic research and professional environments where statistical analysis is important.
Popular R packages include:
- ggplot2: Data visualization
- dplyr: Data manipulation
- tidyr: Data cleaning and transformation
R is particularly useful for exploratory data analysis, hypothesis testing, statistical modeling, and research. It is commonly used in fields such as healthcare, social sciences, finance, and research.
Understanding Data Visualization Tools
Why Visualize Data?
Data visualization transforms raw information into visual insights. Well-designed charts and dashboards make complex datasets easier to understand and help users identify important trends and patterns.
Popular Data Visualization Tools
- Excel: Useful for basic charts, pivot tables, and small datasets.
- Power BI: Provides interactive reports and strong integration with Microsoft products.
- Tableau: Offers drag-and-drop dashboard and data visualization capabilities.
- Matplotlib and Seaborn: Popular choices for creating visualizations with Python.
- D3.js: A JavaScript library for creating advanced web-based data visualizations.
Features to Look For
When selecting a visualization tool, consider features such as:
- Interactive filtering and drill-down capabilities
- Integration with different data sources
- Scalability for large datasets
- Ease of use and accessibility
- Dashboard and reporting capabilities
Machine Learning Tools for Advanced Analysis
Scikit-learn
Scikit-learn is a popular Python machine learning library for traditional machine learning tasks such as classification, regression, clustering, and model evaluation. It is beginner-friendly and has extensive documentation.
TensorFlow
TensorFlow, developed by Google, is a machine learning framework commonly used for deep learning and large-scale artificial intelligence applications.
PyTorch
PyTorch is a deep learning framework known for its flexibility and is widely used in research and machine learning development.
RapidMiner
RapidMiner provides an end-to-end data science platform with visual workflows. Its interface can be useful for teams with different levels of technical expertise.
Azure Machine Learning
Azure Machine Learning is a cloud-based platform from Microsoft for building, training, and deploying machine learning models.
Advanced Data Analysis Techniques
Deep Learning
Deep learning is used for complex tasks such as image recognition, natural language processing, and advanced pattern detection. Neural network architectures such as CNNs and RNNs can be used for specialized problems.
Anomaly Detection
Anomaly detection identifies unusual observations or patterns in a dataset. It is particularly useful in areas such as fraud detection, cybersecurity, and quality control.
Bayesian Inference
Bayesian inference combines prior knowledge with observed data to estimate probabilities and make predictions under uncertainty.
Survival Analysis
Survival analysis is used to study time-to-event outcomes. It is commonly applied in healthcare, engineering, and other fields where understanding the time until an event occurs is important.
Time Series Forecasting
Time series analysis examines data collected over time. Techniques and tools such as LSTM models and Prophet can be used to identify patterns and support forecasting for areas such as demand planning and financial analysis.
Optimization Algorithms
Optimization algorithms help identify effective solutions to complex problems. Techniques such as genetic algorithms and simulated annealing can be applied when traditional approaches are not sufficient.
List of Key Data Analysis Tools
| Tool | Purpose |
|---|---|
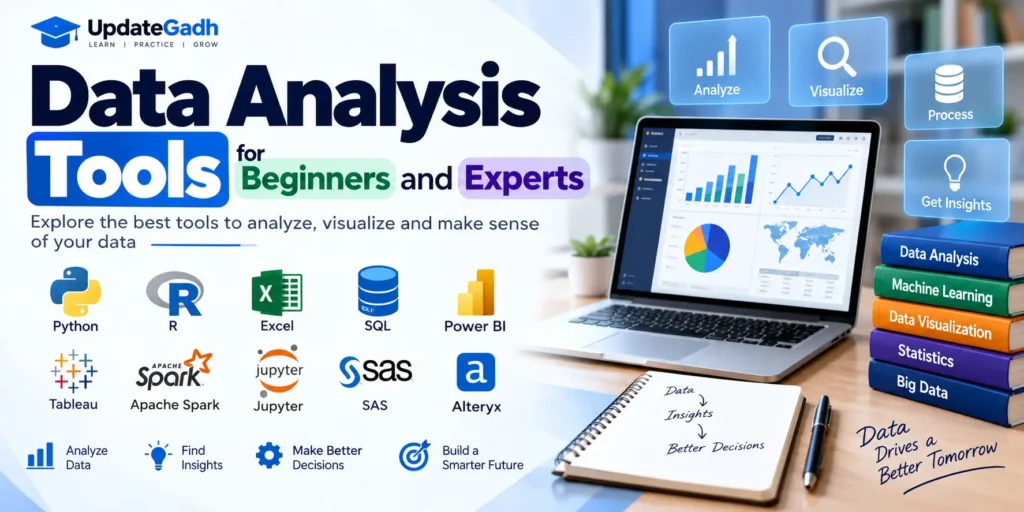
| Python | Full-stack data analysis and machine learning using libraries such as Pandas, NumPy, and Matplotlib. |
| R | Advanced statistical analysis and visualization using packages such as ggplot2 and tidyverse. |
| SQL | Querying, managing, and analyzing data stored in databases. |
| Excel | Basic data analysis, calculations, charts, and visualization. |
| Power BI | Business intelligence dashboards, interactive reports, and data analysis. |
| Tableau | Interactive dashboards and data storytelling. |
| Apache Spark | Large-scale data processing and distributed computing. |
| Jupyter Notebooks | Combines coding, data analysis, visualizations, and documentation in one environment. |
| SAS | Enterprise-level statistical analysis and data management. |
| Alteryx | Visual data blending, preparation, and analytics. |
Download New Real-Time Projects:- Click here
Conclusion
The world of data analysis offers a wide range of tools for different levels of experience and different analytical requirements. Beginners can start with simple tools such as Excel, while experienced professionals can work with Python, R, SQL, Power BI, Tableau, and machine learning frameworks.
The most important factor is choosing the right data analysis tool for the right purpose. Whether you are creating a small business report, analyzing research data, building dashboards, or developing advanced machine learning models, the right tools can help you transform raw data into valuable insights.
Keywords
Data Analysis Tools for Beginners and Experts, data analysis tools, data analytics tools for beginners, data analytics tools list, data analysis tools in research, data analytics tools and techniques, data analytics tools free, analysis tools examples, data analysis tools in Excel, data analysis tool online free, data analysis tools AI, data analysis, Python data analysis, R data analysis, data visualization tools, machine learning tools data analysis tools
data analytics tools for beginners
data analytics tools list
data analysis tools in research
data analytics tools and techniques
data analytics tools free
analysis tools examples
data analysis tools in excel
data analysis tool online free
data analysis tools in research
data analysis tools free
data analysis tools list