Data Analysis Tutorial
Data Analysis, also known as Data Analytics, is an important part of informed decision-making. It involves examining, cleaning, processing, modeling, and transforming raw data to discover meaningful insights, develop useful conclusions, and support better decisions.
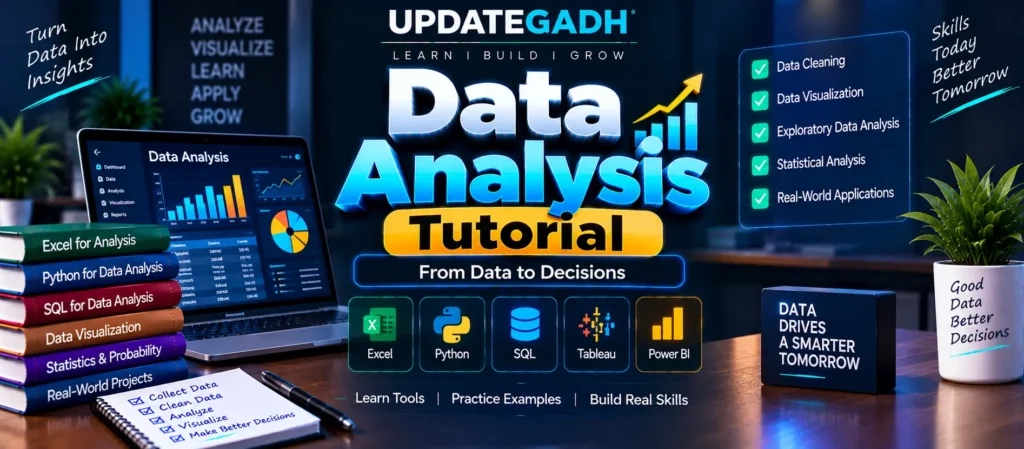
This Data Analysis Tutorial covers both fundamental and advanced concepts, including data preprocessing, exploratory data analysis, probability distributions, time series analysis, visualization, and commonly used tools such as Excel, Python, and SQL.
Complete Advance AI Topics: Click Here
SQL Tutorial: Click Here
What is Data Analysis?
Data Analysis is a structured process of examining datasets to identify useful information, patterns, and insights that can support data-driven decisions. The process can be divided into six important steps:
- Data Requirements Specification
- Data Collection
- Data Processing
- Data Cleaning
- Data Analysis
- Communication
Together, these steps help transform raw and unstructured information collected from different sources into meaningful insights that can be used for decision-making.
Prerequisites for Data Analysis
To develop strong Data Analytics skills, it is useful to understand several important technologies and concepts.
- Python for Data Analysis: Python provides flexible tools for analyzing, manipulating, and visualizing datasets.
- SQL for Data Analysis: SQL is useful for querying data and working with databases efficiently.
- Data Visualization: Visualization techniques help represent data graphically so that patterns and trends can be understood more easily.
- Data Analysis Libraries: Libraries such as Pandas and NumPy provide important functionality for working with and analyzing data.
Mastering Data Analysis Tools
Pandas Tutorial
Pandas is a powerful Python library for data manipulation and analysis. It can be used to work with datasets, perform data cleaning operations, and prepare information for analysis and visualization.
NumPy Tutorial
NumPy is widely used for numerical computing in Python. It provides support for arrays, matrices, and mathematical operations and forms an important foundation for many other data science libraries.
Understanding the Data
Before performing analysis, it is important to understand the data being used and the way it is structured.
- What is Data? Data consists of raw facts and information that can be examined and interpreted to obtain useful insights.
- Sample vs. Population Statistics: Understanding the difference between a sample and a population is important when working with statistical data.
- Data Types: Data can be categorized in different ways, including qualitative and quantitative data, as well as univariate and multivariate data.
Common Data Types
- Qualitative vs. Quantitative
- Univariate vs. Multivariate
- Nominal
- Ordinal
- Interval
Reading and Loading Datasets
Data analysts commonly work with datasets stored in different file formats. Pandas can be used to read and load formats such as:
- CSV files
- JSON files
- Excel files
After loading the data, it can be manipulated, analyzed, and exported according to the requirements of the analysis.
Data Preprocessing
Data preprocessing is the process of transforming raw data into a clean and structured format. Proper preprocessing is important for producing reliable and meaningful analytical results.
Data Formatting
- Adjusting data types and formats to maintain consistency.
- Managing date and time formats when working with Pandas.
Data Cleaning
- Missing Values: Identifying and handling missing values using techniques such as Simple Imputer or Pandas.
- Outliers: Detecting and addressing unusual observations using approaches such as Z-scores, box plots, and clustering techniques.
Data Transformation
- Normalization and Scaling: Techniques such as Z-score normalization and Min-Max scaling can be used to transform numerical data.
- Standardization: Helps transform data into a more consistent form for analysis.
- Log and Power Transformations: These transformations can be applied when appropriate to modify the distribution of data.
Data Sampling
Data sampling involves selecting a portion of a population for analysis. Common approaches include:
- Random Sampling
- Stratified Sampling
- Cluster Sampling
- Other probability and non-probability sampling methods
Exploratory Data Analysis (EDA)
Exploratory Data Analysis (EDA) is an important stage of data analysis. It helps analysts understand the structure of a dataset, discover patterns, identify unusual observations, and prepare data for further analysis or modeling.
Univariate Analysis
Univariate analysis focuses on examining a single variable at a time.
- Central Tendency: Mean, Median, and Mode
- Measures of Spread: Variance and Standard Deviation
- Visualizations: Histograms and Boxplots
Multivariate Analysis
Multivariate analysis examines relationships between multiple variables. Common approaches include:
- Correlation Matrix
- Factor Analysis
- Cluster Analysis
- Scatter Plots
- Heatmaps
Probability Distributions
Understanding probability distributions is important for statistical analysis. Distributions describe how values are spread across a dataset and help analysts understand patterns in data.
Some commonly used probability distributions include:
- Normal Distribution
- Binomial Distribution
- Poisson Distribution
- T-Distribution
Statistical concepts such as p-values, confidence intervals, and hypothesis testing are also important for interpreting analytical results and drawing conclusions from data.
Time Series Analysis
Time Series Analysis focuses on data collected over a period of time. It can be used to identify trends, seasonal patterns, and unusual changes within time-dependent datasets.
Key Concepts
- Stationarity Testing: The Augmented Dickey-Fuller Test can be used to examine stationarity.
- Moving Averages: Useful for analyzing and smoothing time-dependent data.
- Autocorrelation: Helps examine relationships between observations at different time intervals.
- Seasonality Detection: Helps identify repeating patterns within time series data.
Top Tools for Data Analysis
1. Excel
Microsoft Excel is an accessible data analysis tool that can be useful for working with small to medium-sized datasets. It provides spreadsheet functions and features for organizing, analyzing, and presenting data.
2. Tableau
Tableau is a data visualization platform designed for creating interactive visualizations and dashboards. It can help users explore data and communicate insights visually.
3. Power BI
Power BI is a business intelligence and reporting tool that can be used to analyze data and create interactive reports and dashboards.
Applications of Data Analysis
Data Analysis has applications across many industries and business processes. Some important applications include:
- Better Decision-Making: Data insights can support decisions based on analyzed information rather than relying only on intuition.
- Risk Identification: Data analysis and simulations can help identify potential risks and support planning.
- Efficiency Improvement: Organizations can use data insights to identify inefficient processes and improve operations.
- Customer Behavior Tracking: Analyzing customer patterns can provide insights useful for product development and marketing strategies.
- Relevant Product Delivery: Data insights can help businesses understand market requirements and tailor their offerings accordingly.
Download New Real Time Projects :- Click here
Conclusion
Data Analysis is an essential process for converting raw information into meaningful insights. From data collection and preprocessing to EDA, statistical analysis, visualization, and time series analysis, each stage contributes to understanding data effectively.
Learning tools such as Python, Pandas, NumPy, SQL, Excel, Tableau, and Power BI can provide a strong foundation for working with data. By developing these skills, students and professionals can better understand datasets and use analytical insights to support informed decision-making.
Keywords
Data Analysis Tutorial, data analysis tutorial pdf, data analysis tutorial python, data analysis tutorial for beginners, data analytics tutorial w3schools, data analysis tutorialspoint, data analysis tutorial geeksforgeeks, data analysis for beginners pdf, data analytics tutorial javatpoint