
COVID-19 Dashboard
Introduction:
A simple project based on COVID-19 Dashboard which is developed using Python and Django. This project is designed to display and track coronavirus data in a clear and organized manner. It provides users with updated reports, charts, and data visualization to better understand the situation.
The application has an easy-to-use interface, making it simple for users to navigate and analyze information. This project is practical, beginner-friendly, and a great choice for students or developers who want to strengthen their skills in web development and data handling.
Download New Real Time Projects :-Click here
Project Details:
- Project Name: COVID-19 Interactive Dashboard
- Language(s) Used: Python, Django
- Python Version (Recommended): 3.0.7 or above
- Database: PostgreSQL
- Type: Web Application
- Developer: UPDATEGADH
Available Features
The COVID-19 Dashboard project is packed with features that make it not only informative but also practical for real-world use. Each feature has been designed to give users a smooth experience and provide accurate data analysis. Below is the detailed list of available features:
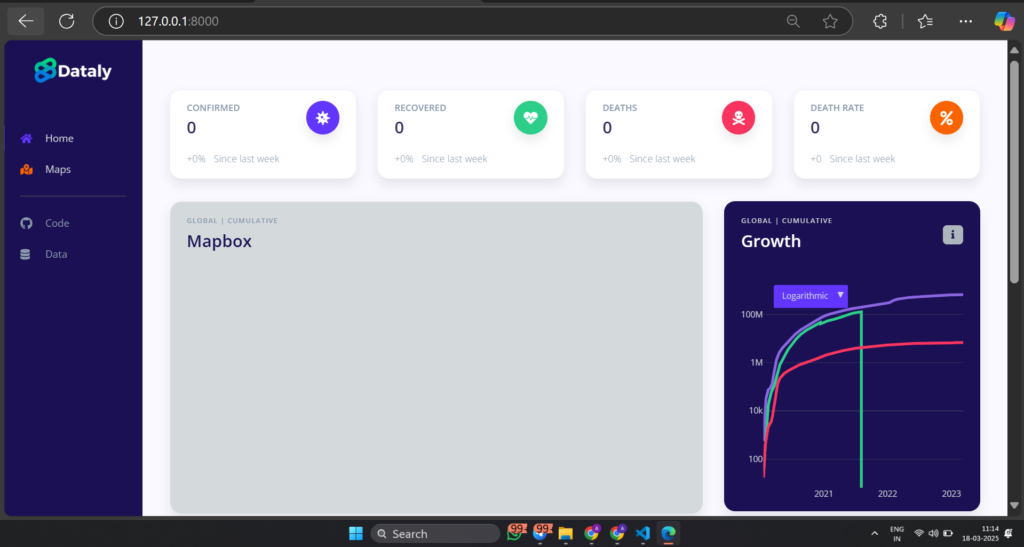
Data Visualization with Plotly – The system uses Plotly, a powerful visualization library, to display data in the form of interactive graphs and charts. This makes the information easier to read, analyze, and understand compared to plain numbers.
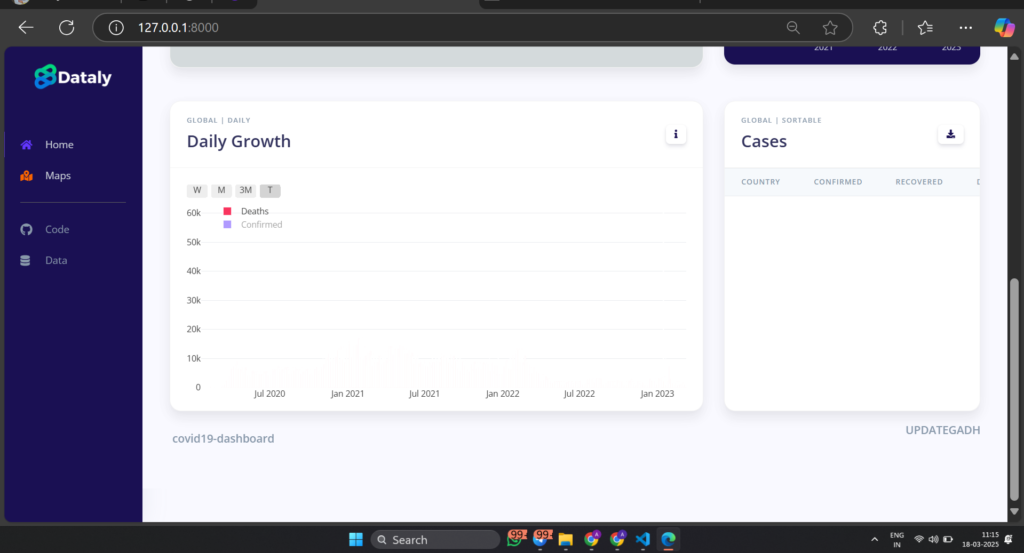
COVID-19 Statistics Dashboard – A centralized dashboard provides users with the latest updates on coronavirus cases. It shows important statistics like confirmed cases, recoveries, deaths, and active cases in a clear format.
Graphs and Charts for Data Analysis – Apart from the dashboard, the system includes detailed graphical representations of data trends over time. Users can view line graphs, bar charts, and other visuals to understand how the pandemic is progressing.
Real-time Data Fetching – The dashboard keeps information up to date by fetching real-time data. This ensures that users always have the most current statistics without needing to refresh or manually enter information.
Admin Panel for Data Management – The system includes a separate admin panel that allows administrators to manage, add, or update records. This feature gives admins control over the data being displayed to ensure accuracy and reliability.
User Authentication System – The project comes with secure login and registration functionality. Users must create an account to access certain features, making the system more personalized and secure.
Printable Reports for COVID-19 Statistics – Users can generate and download reports of COVID-19 data for offline use. These reports can be printed and shared, making it useful for research, study, or official purposes.
Customizable System Settings – The dashboard can be customized according to user or admin preferences. This includes adjusting layouts, chart styles, or selecting specific data ranges for analysis.
Password Protection for Admin Access – To ensure the safety of sensitive information, admin features are password-protected. This prevents unauthorized users from tampering with the data or system settings.
How to Run the Project:
- Download the ZIP file and extract it.
- Install the required dependencies using:
pip install -r requirements.txt - Perform database migrations:
python manage.py migrate - Create a superuser for admin access:
python manage.py createsuperuser - Run the development server:
python manage.py runserver - Access the project at http://localhost:8000
covid-19 dataset covid-19 prediction Kaggle covid-19 data visualization projects covid-19 dataset for tableau covid-19 image dataset Kaggle analysis of covid-19 impact on india using data visualisation covid-19 world data json file download covid-19 india dataset Kaggle covid-19 dashboard in python with source code covid-19 dashboard in python pdf covid-19 dashboard in python GitHub covid-19 dashboard in
🎓 Need Complete Final Year Project?
Get Source Code + Report + PPT + Viva Questions (Instant Access)
🛒 Visit UpdateGadh Store →