
Customer Segmentation Dashboard
Introduction
A simple project based on Customer Segmentation and Insights Dashboard which is developed as a data science and visualization web application to help businesses understand their customers better. In today’s competitive e-commerce world, knowing customer behavior is extremely important. Companies that can segment customers effectively and identify spending patterns have a clear advantage in decision-making, targeted marketing, and improving customer satisfaction.
This project focuses on solving that challenge using data preprocessing, clustering algorithms, and interactive visualization techniques. It makes use of the popular Online Retail dataset from the UCI Machine Learning Repository, which contains real transaction records. By applying clustering methods such as K-Means or hierarchical clustering, the system groups customers into different categories based on their buying patterns, frequency of purchases, and overall spending.
Once the segmentation is done, the insights are presented through a dashboard built with Dash and Plotly. This dashboard is simple, interactive, and easy to understand. It allows users to explore customer segments visually, compare behaviors, and extract meaningful business insights. For example, businesses can identify their high-value customers, occasional buyers, or those at risk of leaving, and plan marketing campaigns accordingly.
As a student project, it is an excellent way to understand how data science is applied in real-world business problems. It covers essential concepts like data cleaning, clustering, data visualization, and dashboard development, which are highly relevant for both academics and industry. By building this project, students not only practice machine learning but also learn how to turn raw data into actionable insights that directly benefit businesses.
The Customer Segmentation and Insights Dashboard is more than just a data project — it is a real-world case study in how businesses use data to stay ahead. It’s an ideal project for students interested in data analytics, business intelligence, and applied machine learning.
Project Overview Table
| Category | Details |
|---|---|
| Project Name | Customer Segmentation and Insights Dashboard |
| Language/s Used | Python (NumPy, Pandas, Scikit-learn, Dash, Plotly) |
| Database | CSV (Online Retail Dataset) |
| Type | Data Analysis and Visualization Project |
Download New Real Time Projects :–Click here
Available Features
This project includes the following key features:
- Data Preprocessing
- Cleans and prepares the raw retail dataset.
- Handles missing values, duplicates, and prepares features for analysis.
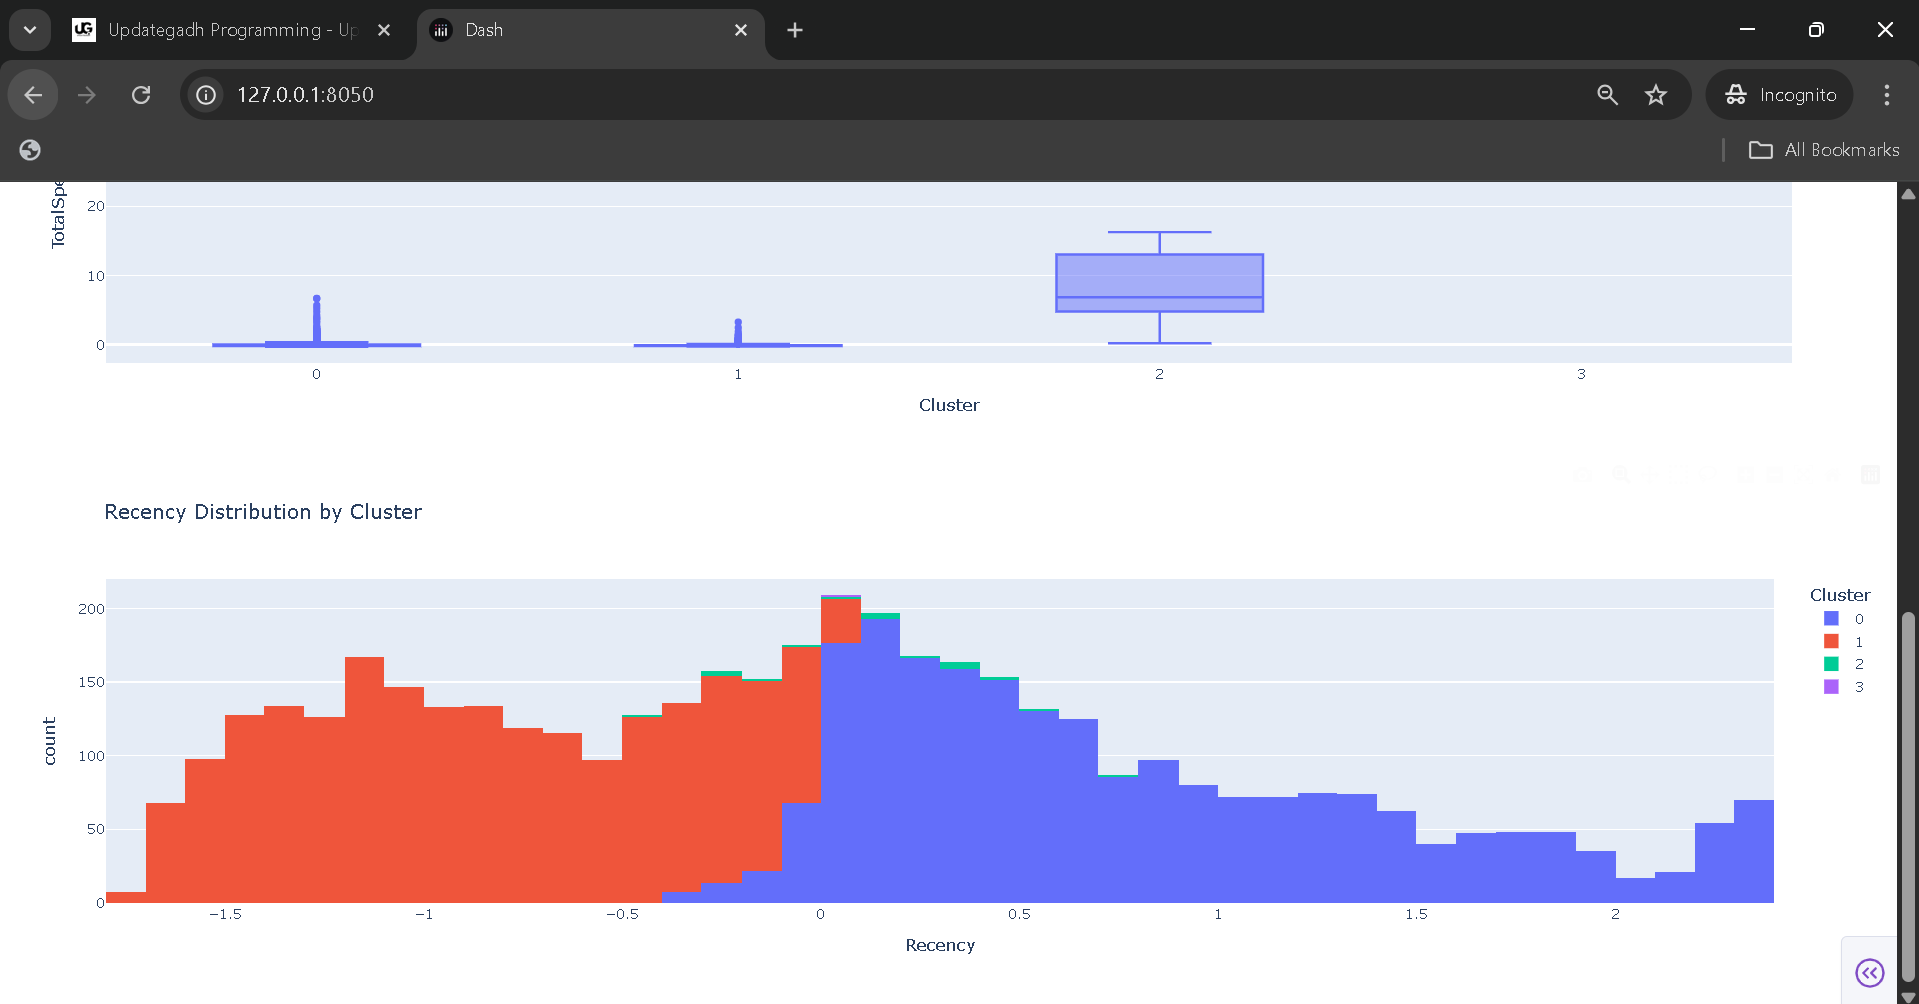
- Customer Segmentation
- Segments customers into meaningful groups using clustering techniques.
- Considers metrics like Recency, Frequency, and Monetary value (RFM model).
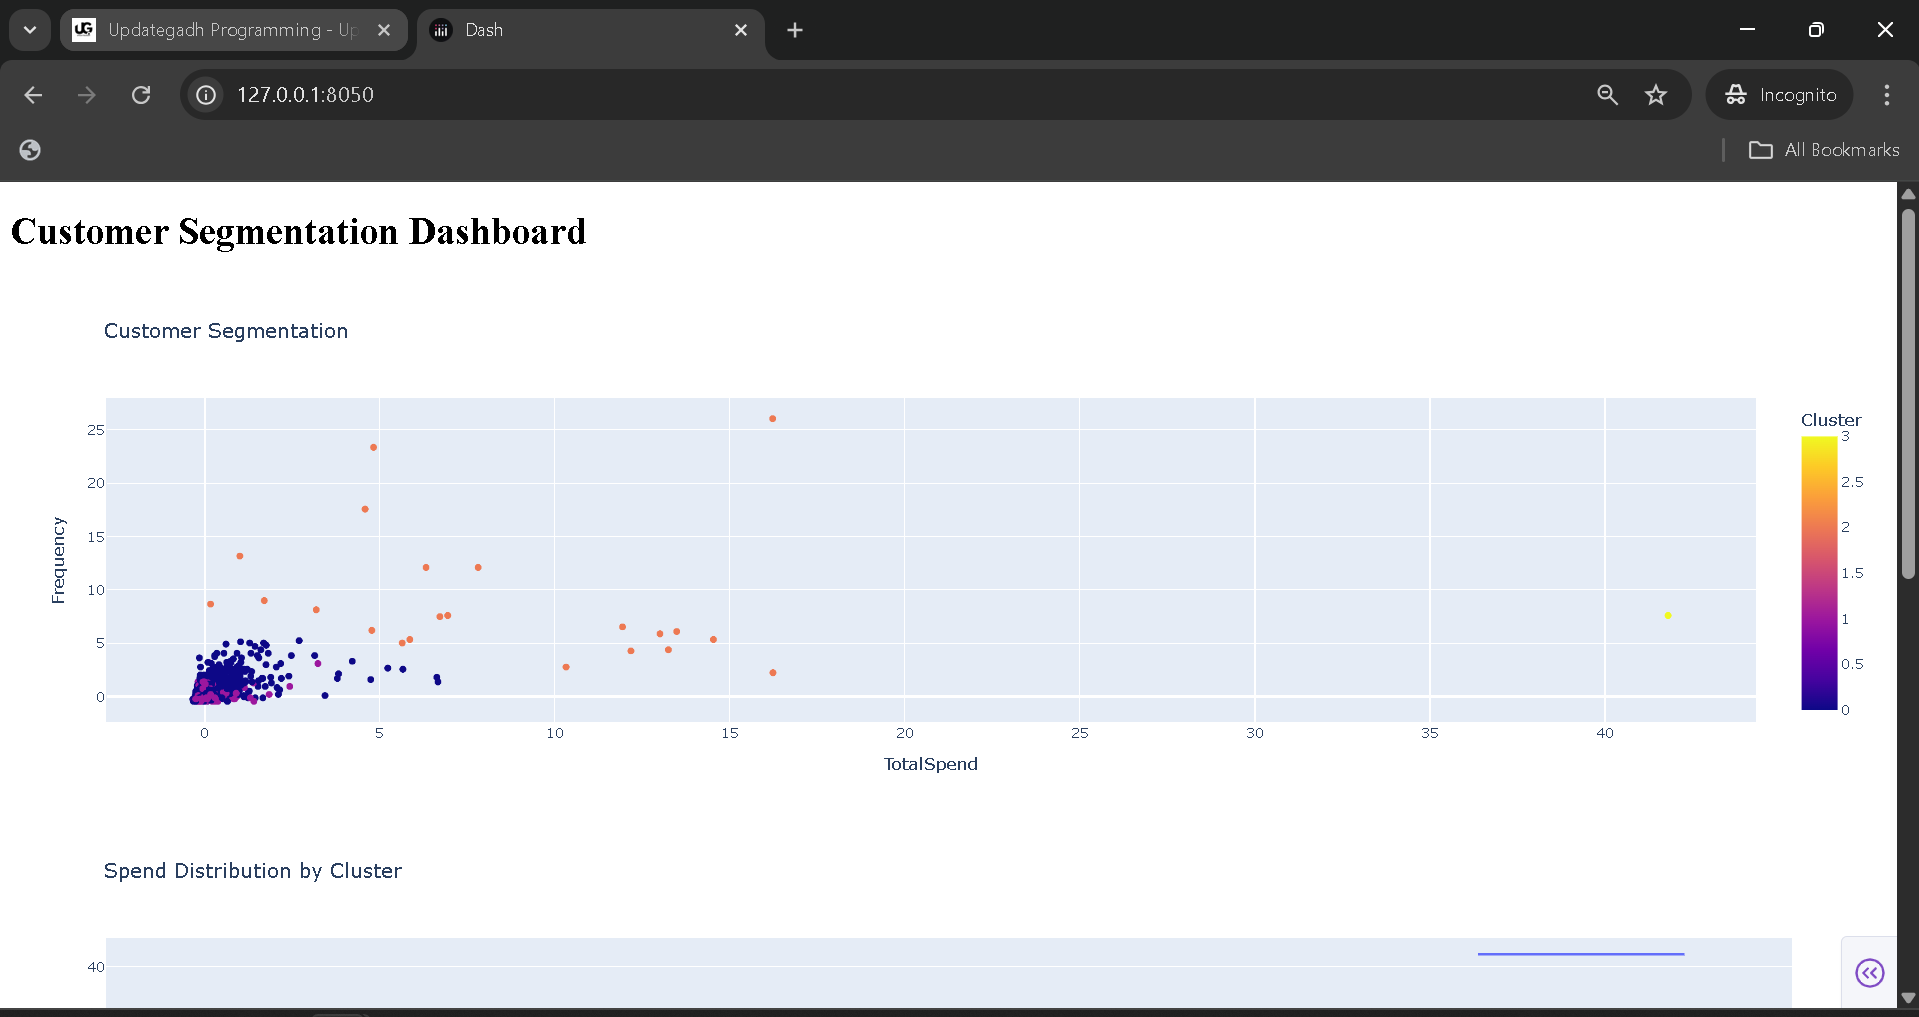
- Interactive Dashboard
- Dash-based web interface for exploring customer clusters.
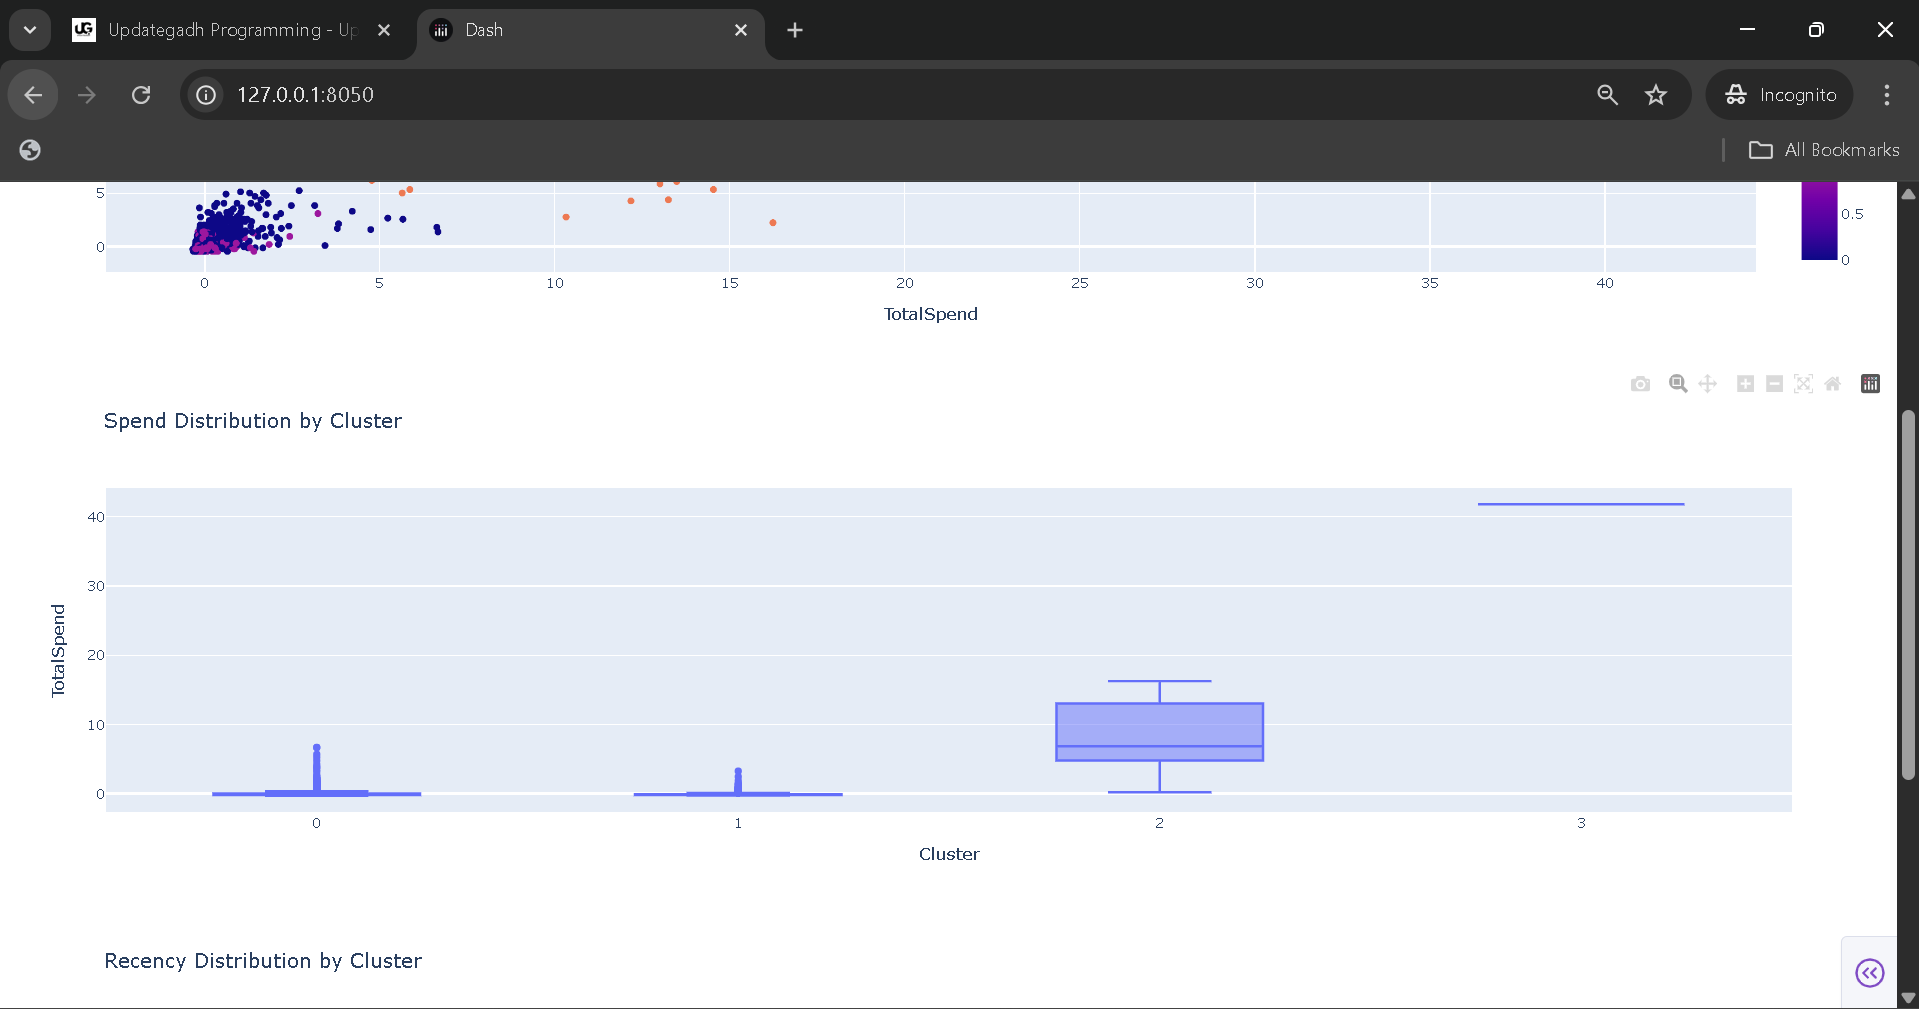
- Visualizations such as bar charts and scatter plots to interpret spending behavior.
- Actionable Insights
- Identifies which groups of customers are high-value and which are at risk.
- Provides businesses with a foundation for marketing strategies.
Installation Guide (VS Code)
Follow the steps below to set up and run the project in Visual Studio Code:
1. Clone or Extract the Project
If you have the project as a zip file, extract it into a folder. Open the folder in VS Code.
cd customer_segmentation_dashboard2. Create a Virtual Environment
Creating a virtual environment ensures dependencies are isolated.
python -m venv venv
Activate the environment:
- On Windows:
venv\Scripts\activate - On macOS/Linux:
source venv/bin/activate
3. Install Dependencies
Install all required libraries:
pip install numpy pandas seaborn matplotlib scikit-learn dash plotly
4. Run Data Preprocessing
This step prepares the dataset for clustering.
python scripts/data_preprocessing.py
5. Perform Customer Segmentation
Cluster customers based on the RFM metrics.
python scripts/customer_segmentation.py
6. Launch the Dashboard
Finally, run the app:
python app/app.py
Open your browser and navigate to the provided local URL (usually http://127.0.0.1:8050/) to view the dashboard.
Usage
The project is primarily designed for analysts, students, and researchers who want to explore customer behavior. Here’s how different users can utilize it:
- Business Analysts
They can use the dashboard to identify customer groups with high spending, frequent purchases, or long gaps between purchases. - Marketing Teams
By studying customer clusters, marketing strategies such as personalized offers, loyalty rewards, or re-engagement campaigns can be designed. - Students and Researchers
This project is a hands-on example of how machine learning (clustering) and visualization tools (Dash/Plotly) can be applied to real-world business data.
Unlike role-based systems (e.g., Donor/Recipient/Admin), this dashboard is focused on data-driven decision-making through interactive exploration.
Contributing
Contributions are welcome to improve the project further. If you would like to enhance features, optimize clustering, or add new visualizations:
- Fork the project.
- Create a new branch for your feature.
- Commit your changes with clear messages.
- Submit a pull request with details of the modifications.
This ensures the project remains organized and continues to grow.
License
This project is released under the MIT License.
You are free to use, modify, and distribute it in compliance with the license terms. It is intended for educational and learning purposes.
Final Thoughts
From a student’s perspective, working on the Customer Segmentation and Insights Dashboard is both rewarding and educational. It combines multiple aspects of a real-world data science project:
- Data preprocessing (cleaning and preparing raw data).
- Machine learning (clustering customers into groups).
- Visualization (building an interactive dashboard with Dash).
What makes it especially valuable is its practical application. In the real world, e-commerce companies depend on customer segmentation to make better marketing decisions, retain high-value customers, and improve overall profitability.
By completing this project, students not only learn technical skills but also understand how these techniques directly impact businesses. It bridges the gap between classroom concepts and real-world applications, making it an excellent addition to any academic portfolio or resume.
We have projects Available in all languages:–Click Here
customer segmentation dashboard power bi
customer segmentation analysis project
customer segmentation dataset csv
customer segmentation dataset download
customer segmentation dataset github
customer segmentation analysis dataset
customer segmentation dataset kaggle
customer segmentation using machine learning project report
customer segmentation dashboard project github
customer segmentation dashboard project with source code
customer segmentation dashboard project ppt
customer segmentation dashboard project report
customer segmentation dashboard project example
🎓 Need Complete Final Year Project?
Get Source Code + Report + PPT + Viva Questions (Instant Access)
🛒 Visit UpdateGadh Store →